When a Naive Baseline Beats LightGBM: Bike-Sharing Demand with Proper Time-Series CV
Random 5-fold CV makes LightGBM look like the winner on UCI hourly bike-sharing data. Time-series CV says a naive seasonal-mean baseline beats it.
Run the UCI hourly bike-sharing dataset through a random 5-fold cross-validation and LightGBM comes out at 0.405 Log-RMSLE and looks like the obvious winner. Run the same data through a TimeSeriesSplit — train on everything before a certain date, validate on what comes next — and LightGBM lands at 0.595. That is a 46.6 percent increase in error. The naive “seasonal mean of (weekday, hour)” baseline scores 0.509 under the time-respecting split and beats LightGBM outright.
Validation strategy is the story. Random k-fold shuffles the time dimension away, so training folds always contain observations from the future relative to the validation fold. The model learns from information it will not have at inference time, and the CV score flatters it accordingly.
The dataset
17,379 hourly observations from UCI’s Bike Sharing Dataset (Capital Bikeshare, Washington DC, 2011-2012). The target is cnt, the total rentals in that hour. 14 weather and calendar features per row. Data runs continuously from January 2011 through December 2012. Median hourly demand is 142 rentals; the 25th-to-75th percentile range runs from 40 to 281 rentals.
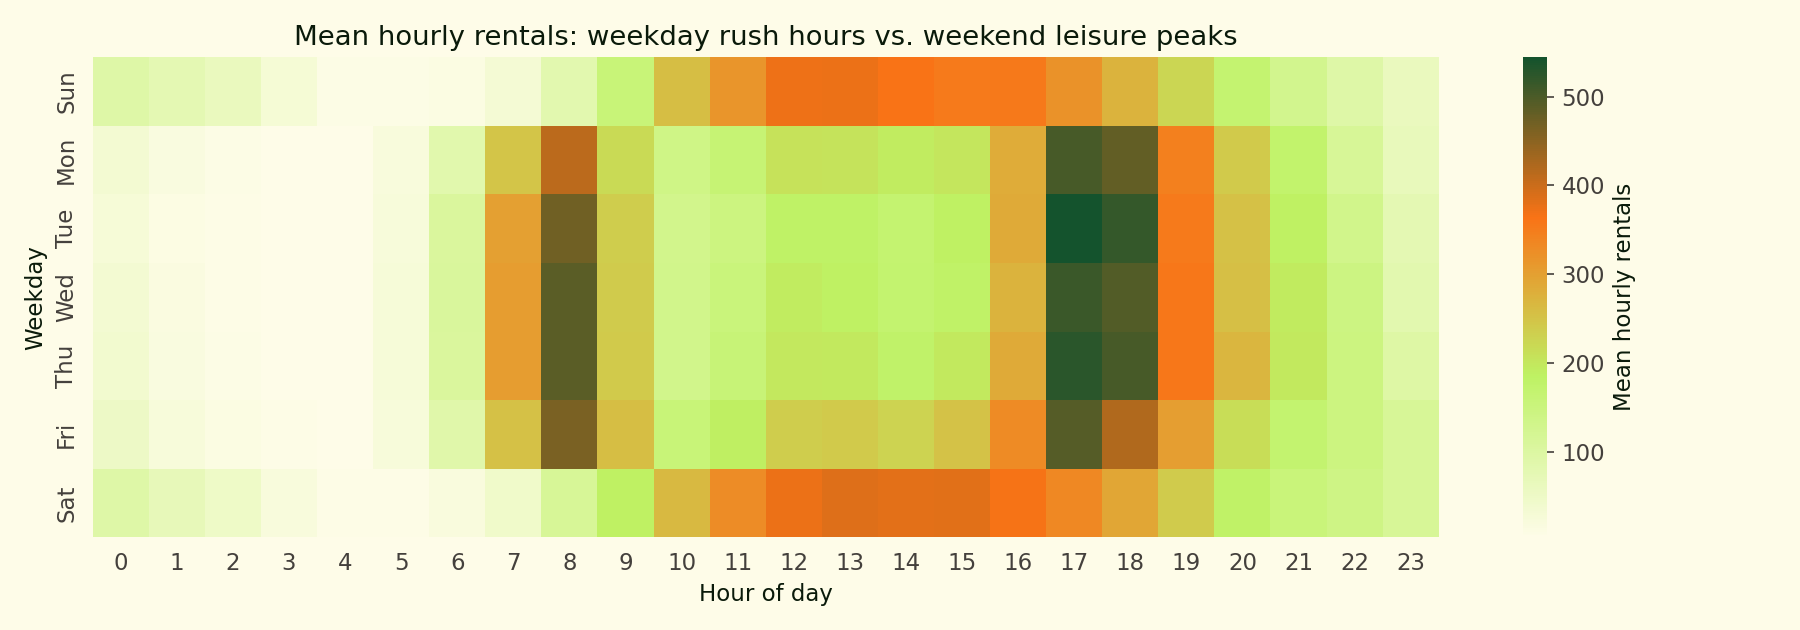
Weekday mornings hit a sharp 8am peak and a bigger 5-6pm peak — classic commuter pattern. Weekends are flatter with one broad afternoon bulge. The bimodal-weekday vs. unimodal-weekend split is why a naive seasonal baseline indexed on (weekday, hour) does well.
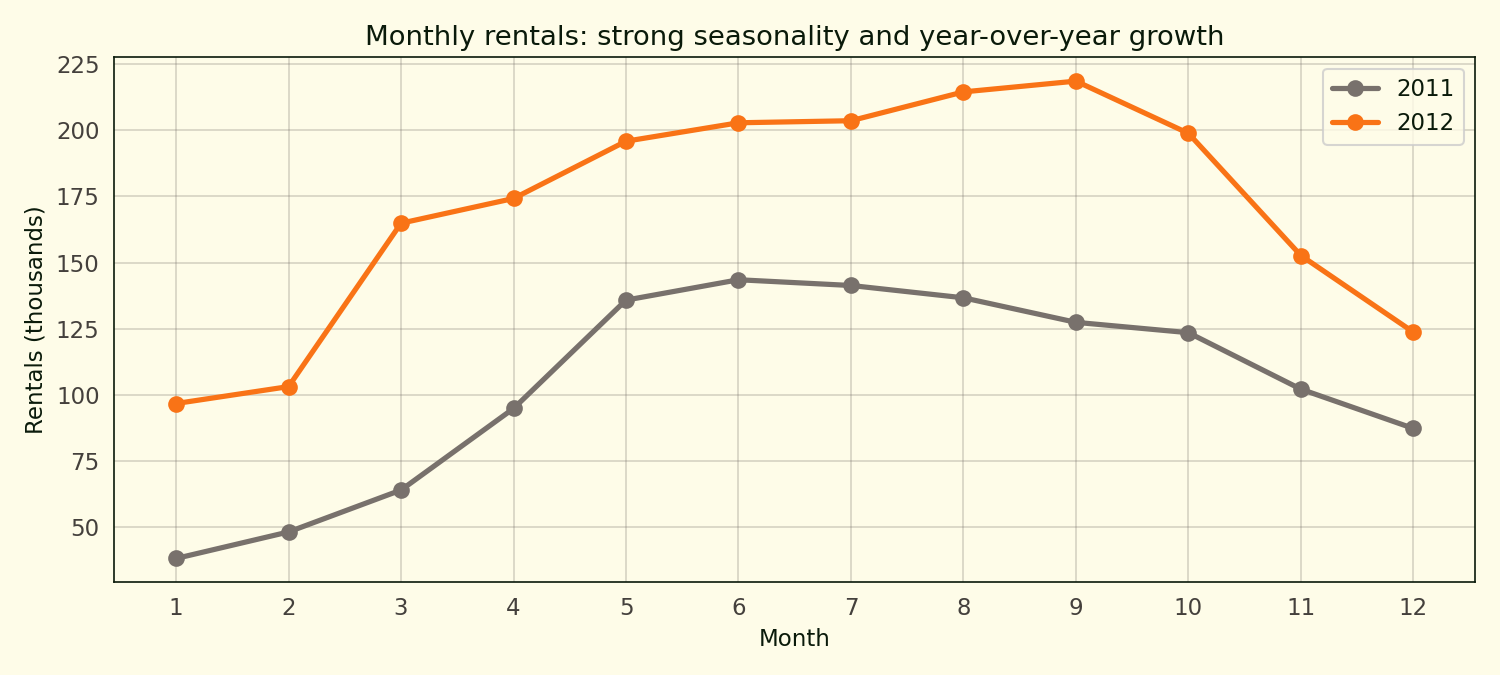
Summer peaks, winter troughs, and 65 percent growth between 2011 and 2012 as the program matured. That growth is another reason time-series CV matters: random k-fold lets a model see 2012 growth during training on “2011 test” folds, which does not happen in deployment.
Method primer: time-series cross-validation and why random folds leak
Cross-validation exists to estimate how a model will perform on data it has not seen. The default tool in scikit-learn is KFold(shuffle=True). It partitions the dataset into k random subsets, trains on k-1 of them, validates on the held-out subset, and rotates. That procedure works when observations are exchangeable, meaning any row is as likely to be the validation target as any other.
Hourly demand on a bike-share system is not exchangeable. A row from December 2012 carries information about the ridership level the program has reached by its second year, information that is causally downstream of every row in 2011. If a random fold places December 2012 in training and April 2011 in validation, the model is learning from the future to score on the past. Deploying that model means predicting hours that come after training, not a random mix.
TimeSeriesSplit enforces chronology. For fold k, training is everything up to timestamp T(k), and validation is the chunk that comes next. Training grows each fold, the validation window slides forward. That matches deployment and strips out the forward-looking leakage. The downside is that earlier folds are trained on less data, so CV variance is higher. That is an honest cost of evaluating honestly. Bergmeir and Benítez (2012) frame the choice in exactly these terms: random CV is valid only when the time dimension carries no information, and for any series with trend or seasonality it does not.
The leakage shows up even on a model that never fits parameters. The naive baseline used here is cnt.groupby(["weekday", "hour"]).mean() — a lookup table. Under random k-fold every validation row sees a seasonal mean computed over the full 24 months, so residuals are small. Under time-series CV the earliest folds have thin training data and the lookup is less accurate, so residuals grow. The baseline’s CV score is worse under the honest split. That is the correct direction of movement; the random number was an artefact.
The headline comparison
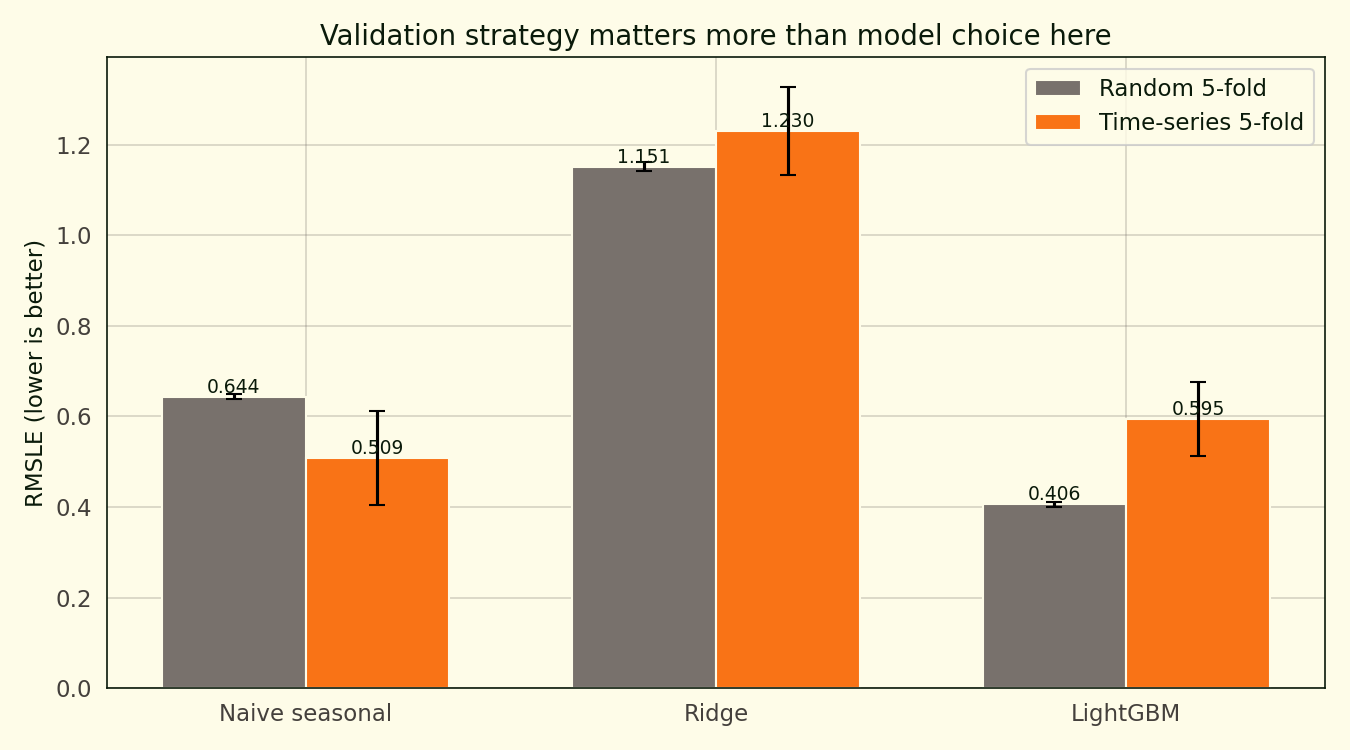
Three models, two cross-validation strategies, six bars.
| Model | Random k-fold | Time-series 5-fold |
|---|---|---|
| Naive seasonal (weekday × hour) | 0.644 | 0.509 |
| Ridge with cyclical features | 1.151 | 1.230 |
| LightGBM with seasonal features | 0.405 | 0.595 |
Under random k-fold, LightGBM wins by a wide margin. Under time-series CV, the naive seasonal baseline wins. LightGBM’s time-series score is 46.6 percent worse than its k-fold score. The naive baseline goes the other direction: its time-series score is 21 percent better than its k-fold score. Time-series CV happens to evaluate it mostly on the second year, where year-one data has already built a stable seasonal lookup.
Ridge sits at Log-RMSLE 1.151 under random k-fold and 1.230 under time-series. A Log-RMSLE of 1.15 translates to a typical multiplicative error factor of about 3.2 on back-transformed predictions — a 142-rentals hour comes out as roughly 45 or 450. Linear models with sin(hour) + cos(hour) cyclical features cannot bend hard enough to capture the commuter-peak demand shape; a tree model pulls far more of that non-linearity for free.
What actually wins
The time-series column of that table is the leaderboard. Read down it and LightGBM lands at 0.595, the naive seasonal mean at 0.509, Ridge at 1.230. The naive baseline wins by 0.086 Log-RMSLE, which is not a rounding gap. LightGBM with engineered weather, cyclical, and interaction features recovers less unseen-future variance than a lookup table indexed on two columns.
That does not mean the engineered features are useless. It means the marginal signal they carry above the seasonal mean is smaller than the signal that mean already captures, and a global hyperparameter choice is not recovering it. The natural next move is to model the residual: fit LightGBM to cnt - seasonal_mean rather than cnt, then add the seasonal mean back at prediction time. That approach is not in this project, but it is the step I would take next if the goal were a production scorer.
Why random k-fold leaks
Top panel: expanding-window TimeSeriesSplit. Each fold trains on an earlier slice of the 2011-2012 timeline and validates on the next slice. Bottom panel: random 5-fold. The same data, same five validation sets, but now validation bars are scattered across every month. The scoreboards update fold by fold so you can watch the Log-RMSLE accumulate under each strategy.
A random training fold pulled uniformly at random from the 17,379 rows contains December 2012 and April 2011 side by side. Validating on the held-out 20 percent, which also spans all 24 months, the model sees future-like information during training that it would never see at inference time. The effect is visible on both the trained models and the untrained baseline.
What this isn’t
Not a Kaggle-competitive submission. Kaggle’s Bike Sharing Demand competition uses a held-out test set from the same time window as training, so random sampling gives a reasonable approximation of what the public leaderboard measures. The point of this project is the opposite — the difference between Kaggle-style random evaluation and what you would actually hit in deployment.
Not a test of modern time-series models either. No Prophet, no LSTM, no Temporal Fusion Transformer. The argument is not that neural nets cannot beat LightGBM here; it is that any model bound for production needs time-respecting validation so you know what score it will actually hit.
Reproducibility note
Source code, notebook, outputs at github.com/ndjstn/bike-sharing-demand. Dataset is hour.csv from the UCI Bike Sharing Dataset mirror on Kaggle (Fanaee-T & Gama, 2014).