Five Archetypes at the Top of YouTube: Creator Segmentation on the Global Top-995
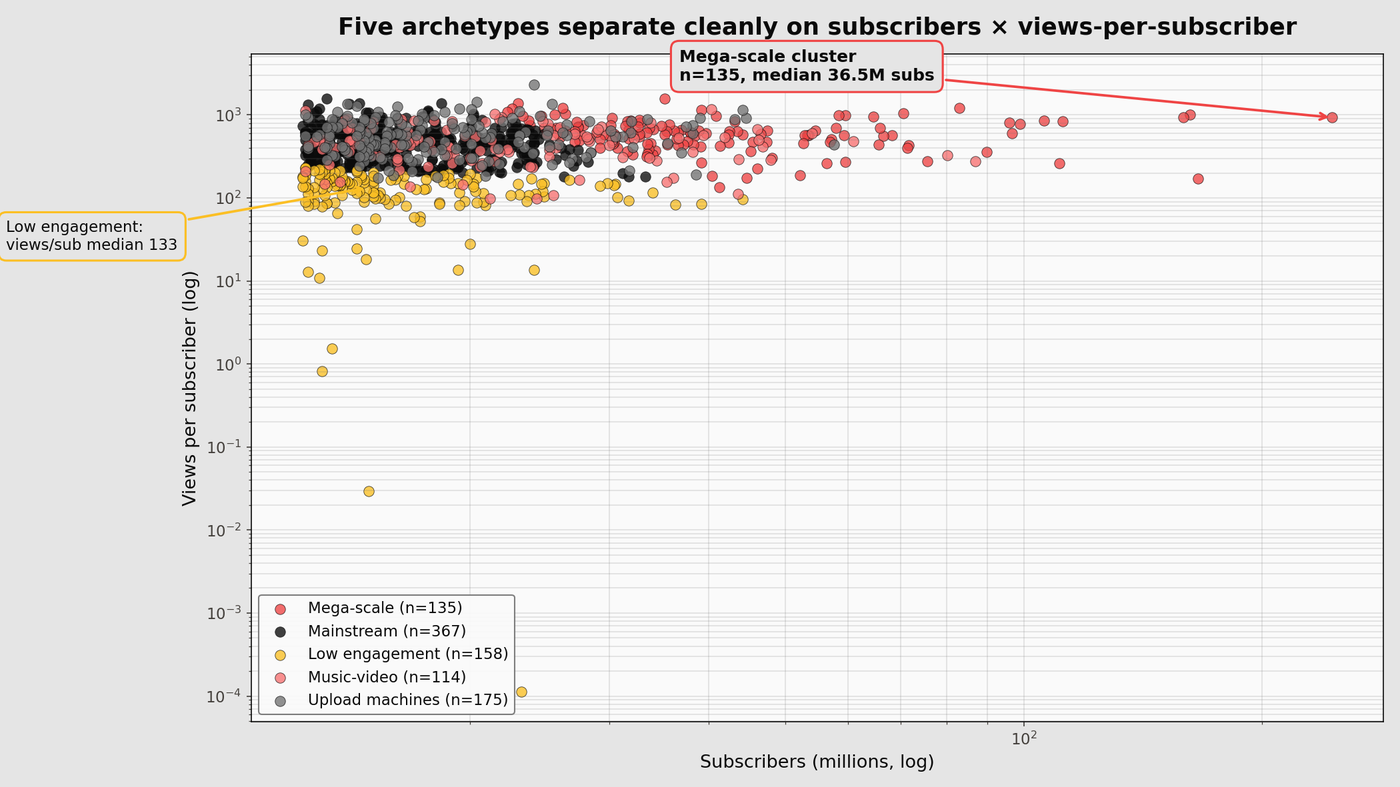
KMeans on the Global YouTube Statistics 2023 dataset produces five distinct creator archetypes: mega-scale, mainstream, low-engagement, music-video, and upload machines.
The Global YouTube Statistics 2023 dataset has 995 top creators with subscriber counts, lifetime video views, upload counts, category, country, and a handful of derived stats. It is a snapshot from mid-2023, so forecasting from it is a mistake; the numbers have shifted since. What earns the effort is finding the structure. KMeans at k=5 on standardised log-features produces five clusters that map onto five recognisable archetypes of top creator, which is a more interesting output than another ranking of MrBeast.
Five archetypes
| Cluster | Median subs | Median views | Median uploads | Views/sub | n | Label |
|---|---|---|---|---|---|---|
| 0 | 36.5M | 22.6B | 1,331 | 592 | 135 | Mega-scale creators |
| 1 | 16.0M | 7.5B | 719 | 436 | 367 | Mainstream large channels |
| 2 | 14.9M | 2.2B | 461 | 133 | 158 | Low-engagement large channels |
| 3 | 20.7M | 9.4B | 12 | 445 | 114 | Music-video channels |
| 4 | 16.9M | 9.5B | 10,022 | 548 | 175 | Upload machines |
Cluster 0 is the top-tier scale phenomenon. 36M median subs, 22B median views, 1,331 uploads. T-Series, MrBeast, Cocomelon, SET India, PewDiePie, and roughly 130 other channels at similar scale. Views per subscriber of 592 means the average subscriber has watched nearly 600 videos on the channel over its lifetime.
Cluster 1 is the mainstream large-channel group — 367 channels at 16M median subs and 7.5B median views. Big, not mega. The largest bucket by count.
Cluster 2 is the finding that most needs explaining. 14.9M subs, 2.2B views, views-per-subscriber of 133 — roughly a quarter of the ratio in every other cluster. Two patterns drive it. First, historical-subscriber decay: channels that accumulated their subscriber base during a hit run and whose audience mostly no longer watches new uploads. Kids’-content channels that rode YouTube’s 2015-2020 recommendation algorithm sit heavily here. Second, short-form fragmentation: channels whose audience is split across many short videos rather than concentrated on a handful of long ones, so any single upload reaches a slice of the subscriber base rather than the whole.
Cluster 3 is the music-video cluster. Median uploads: 12. An order of magnitude below every other cluster. 20.7M subs, 9.4B views from a handful of extremely viral videos. Major-label music channels and one-hit-wonders. Views per upload is 668 million, the highest in the dataset, because each upload is a full music release that accumulates hundreds of millions of plays.
Cluster 4 is the upload-machine cluster. 10,022 median uploads against 16.9M subs and 9.5B views. News networks, clip-compilation channels, daily-vlog channels, and automated content farms. Views per upload is 767,000, two orders of magnitude below the music-video cluster, but high posting volume compensates.
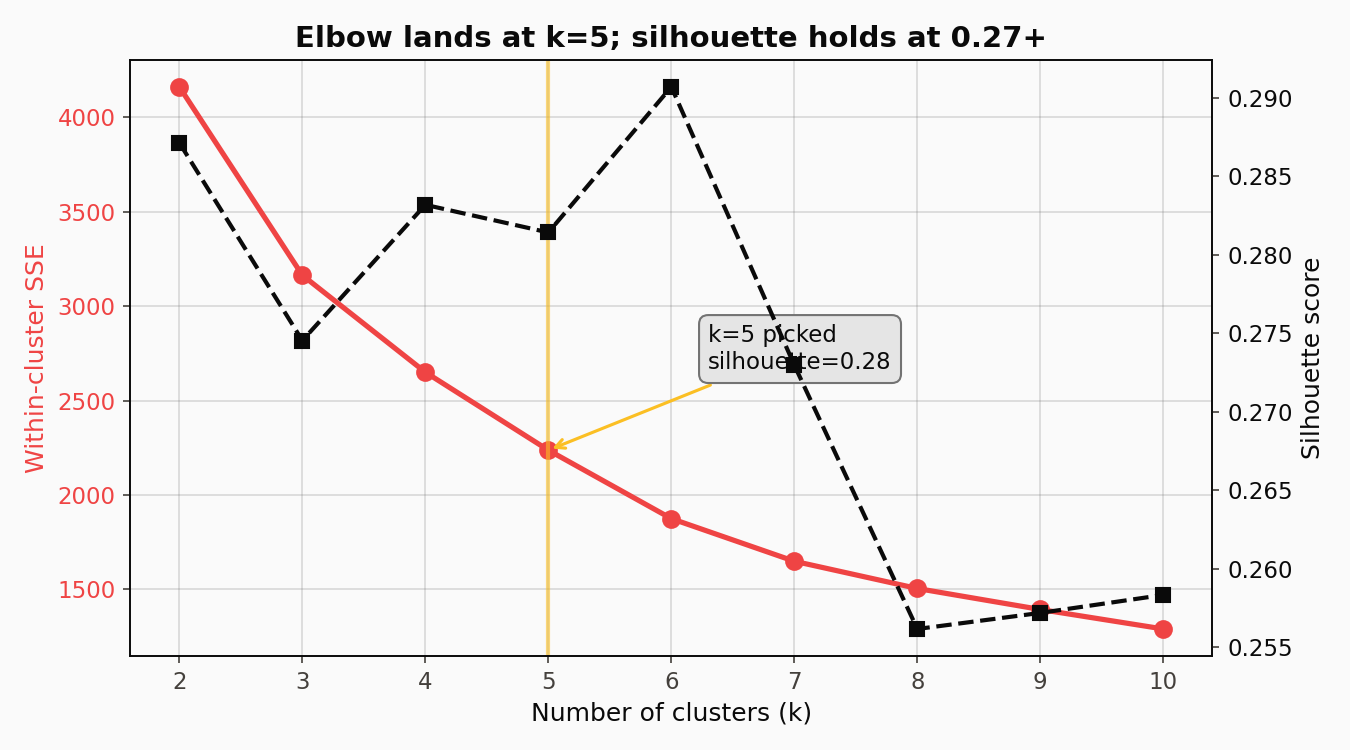
The elbow sits between k=4 and k=5. At k=5 the resulting clusters separate interpretably; adding a sixth cluster splits one of the existing groups along a dimension that doesn’t correspond to an obvious archetype.
How KMeans gets there
KMeans is an alternating optimisation. It partitions n points into k clusters by minimising the within-cluster sum of squared distances to centroids. The procedure alternates two steps: assign every point to its nearest centroid, then update each centroid to the mean of its newly-assigned points. That loop repeats until assignments stop changing, which is guaranteed because each step monotonically decreases the objective and there are only finitely many possible assignments. The final answer depends on initialisation, so scikit-learn runs the algorithm from ten random starts (n_init=10) and keeps the one with the lowest inertia.
The teaching animation: random init, then ASSIGN (points recolour to nearest centroid), then UPDATE (centroids jump to the mean of their assigned points), repeating until convergence. Twelve or so iterations were enough here.
Two practical choices matter a lot for count data like this. Log-transforming before standardising compresses the five-order-of-magnitude spread in subscribers so that distances are not dominated by T-Series alone. Standardising after log-transform centres every feature at zero with unit variance so engagement ratios and raw scale contribute comparably. Skipping either of those steps produces a segmentation with one huge outlier cluster and four cramped neighbours.
Where the creators sit geographically
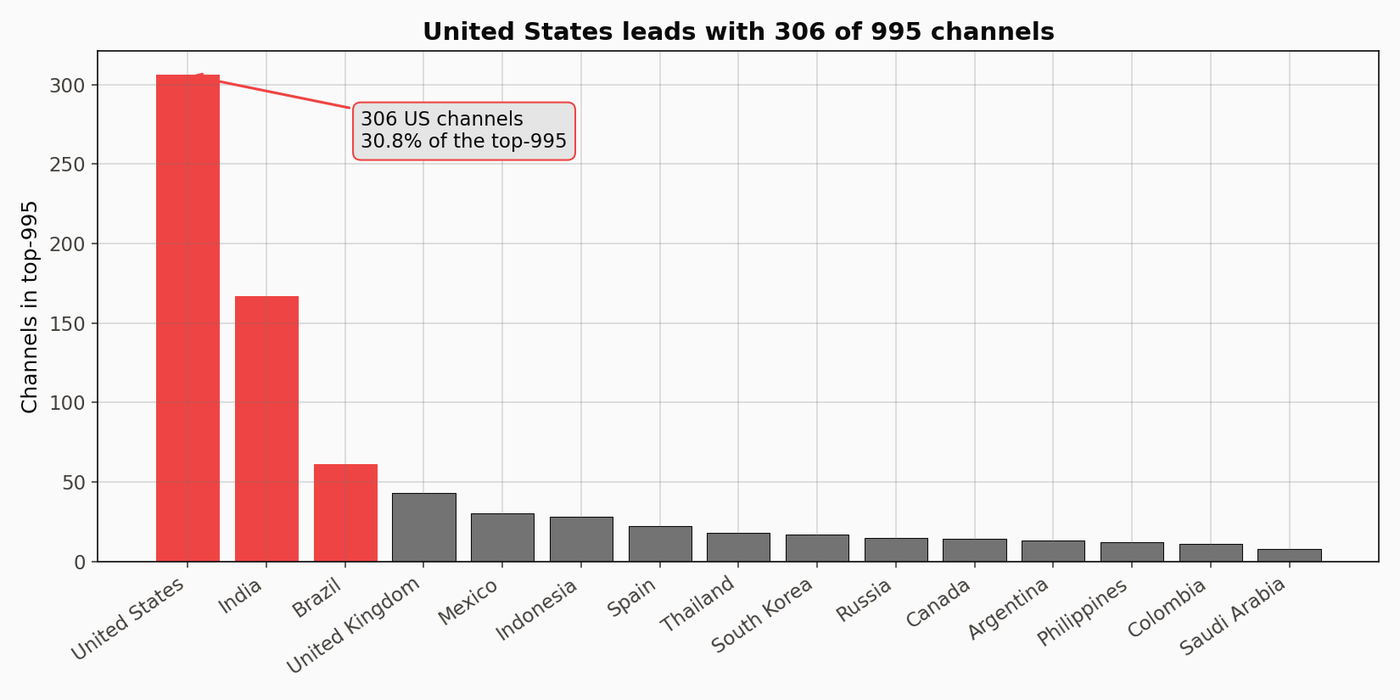
US leads, India and Brazil close behind. Long tail extends through most of Latin America, Europe, and the Gulf.
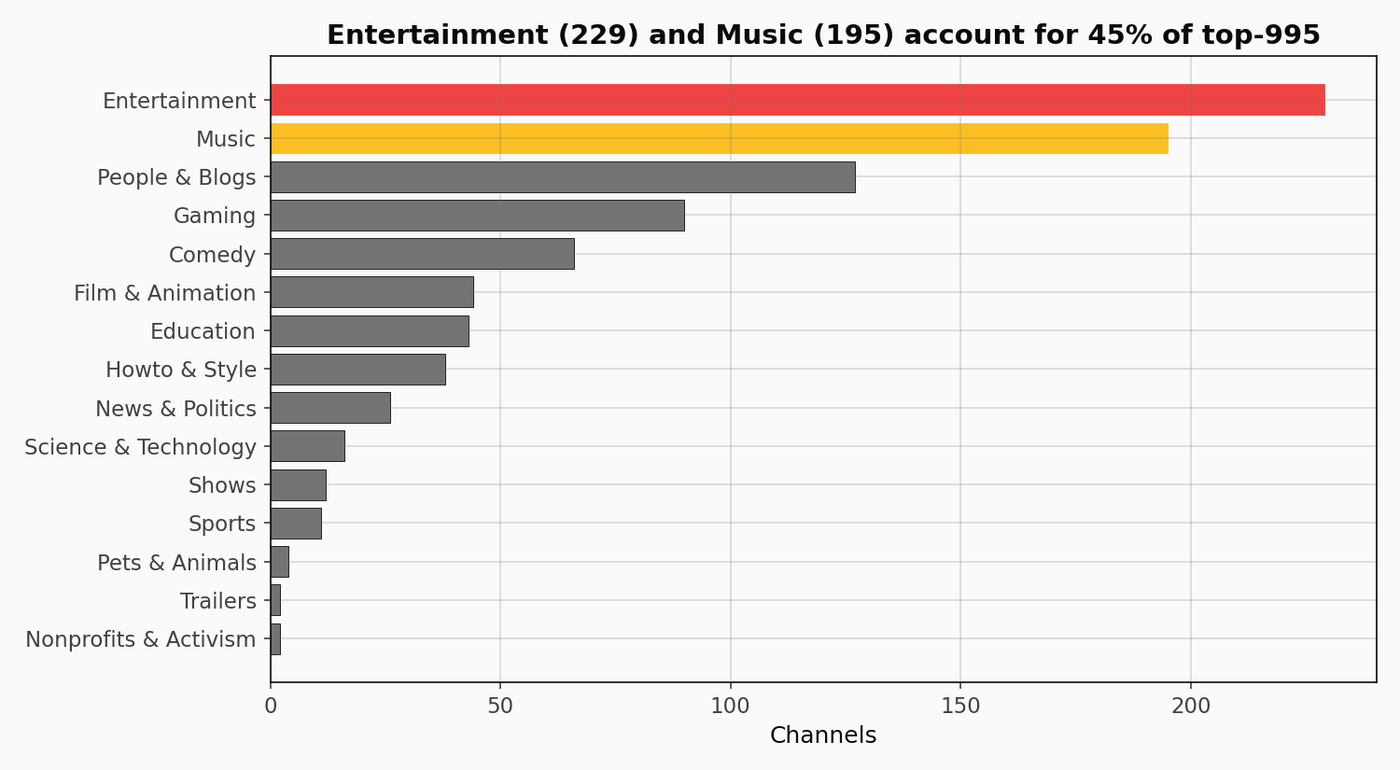
Entertainment leads at 241. Music second at 201. News & Politics at 26, notably sparse for a dataset drawn from top-subscriber channels rather than top-influence channels.
Per-capita, the ranking flips entirely.
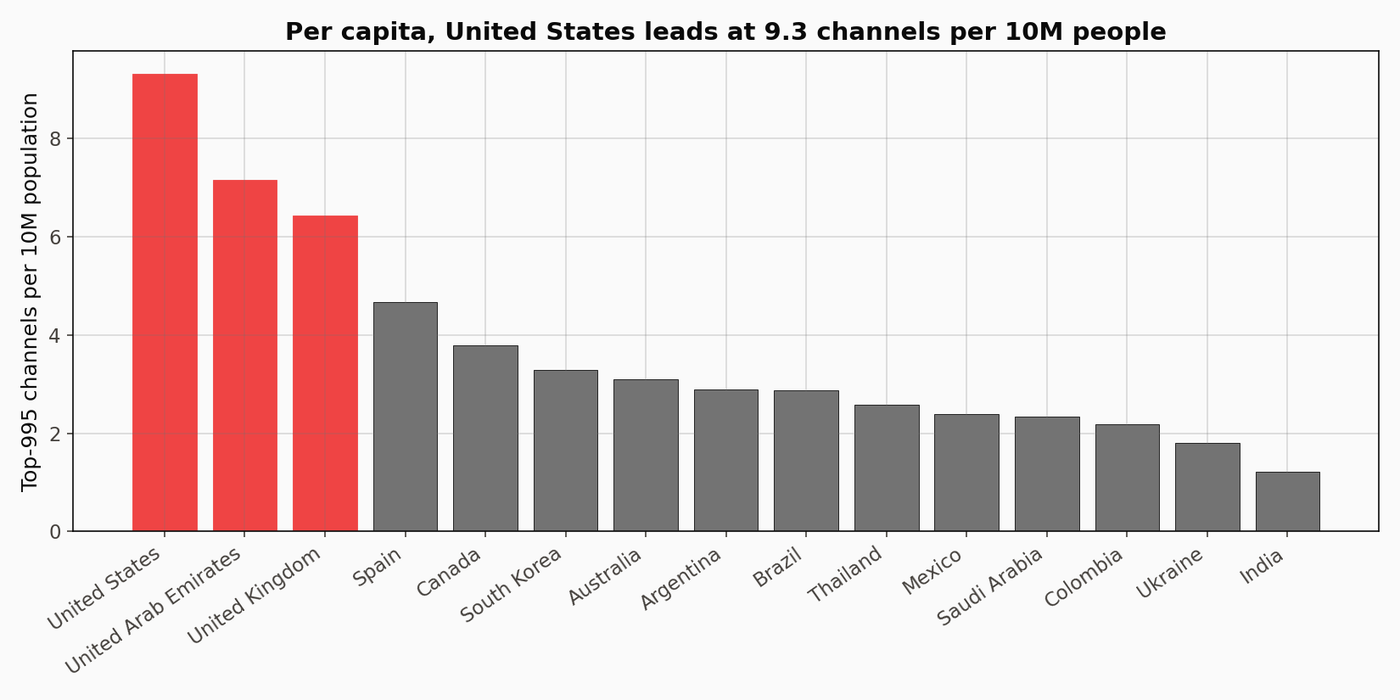
Small English-speaking countries with concentrated creator economies sit at the top: New Zealand, Ireland, Canada, the Netherlands. The US lands mid-pack once calculated per capita. India ranks low after the 1.4 billion is divided through.
Estimated earnings by category
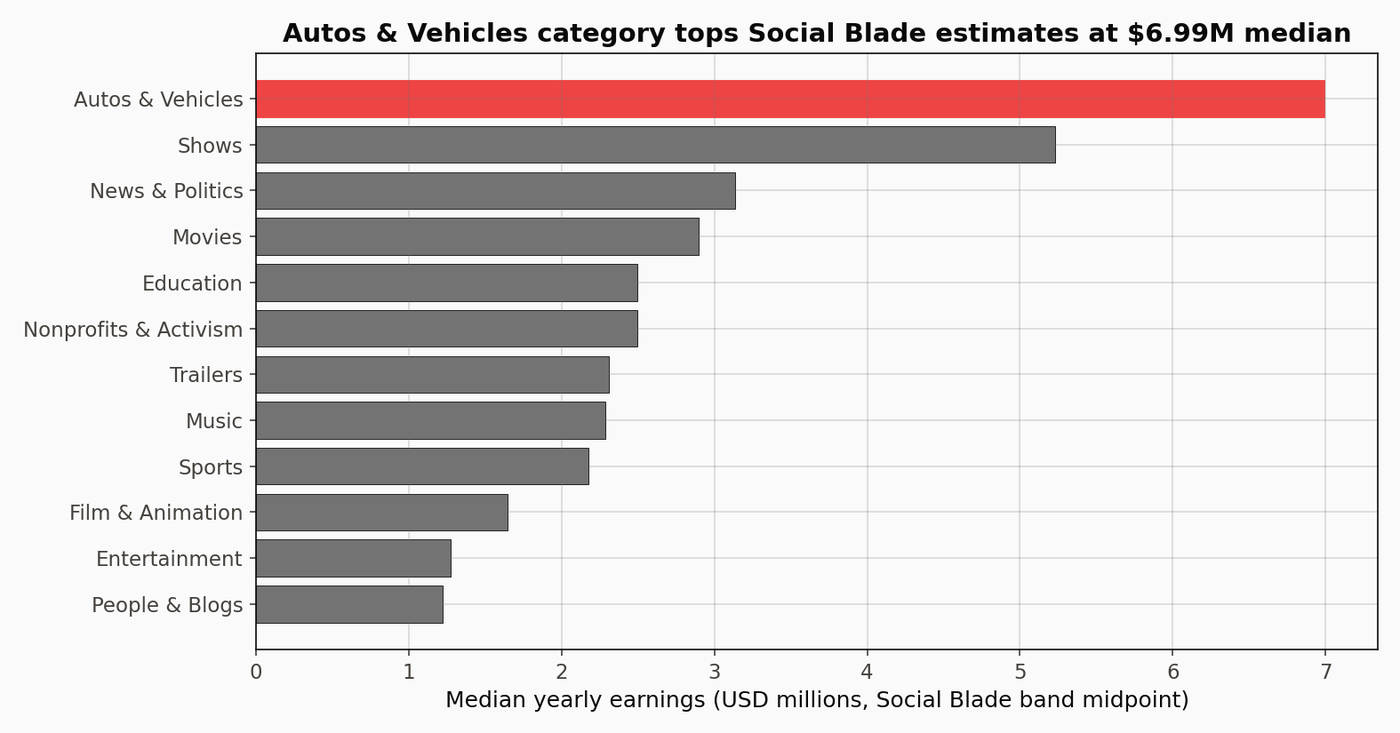
Midpoints of Social Blade’s reported earnings bands. Treat absolute numbers with significant skepticism. Category ordering is more trustworthy than the levels; see the “What this isn’t” section below for the 16x band-width calculation.
Subscribers track views, approximately
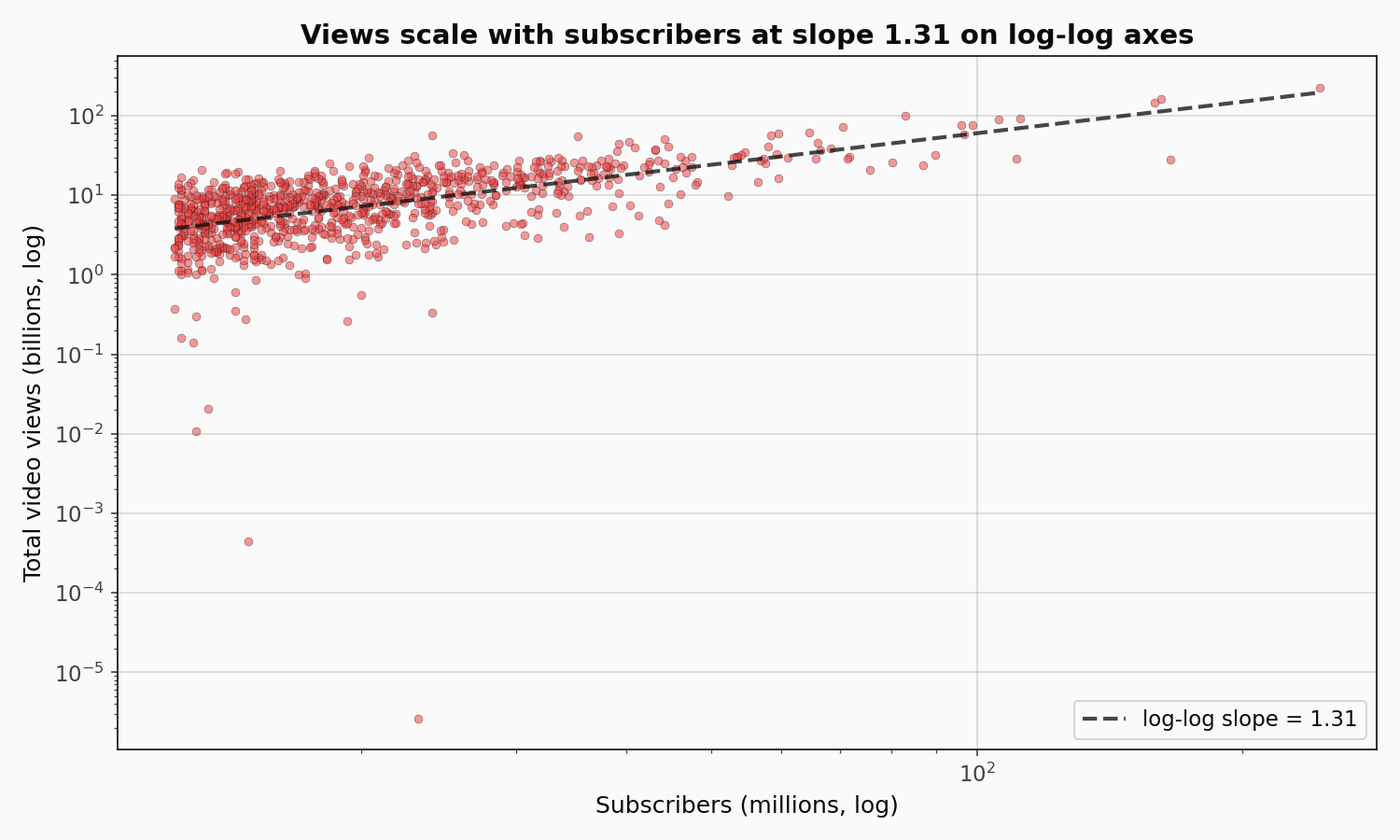
A roughly linear relationship on log scale, with a fitted slope near 1.0. An order of magnitude more subscribers tracks an order of magnitude more views. The scatter around the line is what the clustering picks apart.
What this isn’t
Not a longitudinal analysis. The dataset is a single snapshot. Trends can’t be inferred from it.
Not representative of YouTube creators. It’s the top 995 by subscriber count. Conclusions generalise only to the top of the distribution.
The earnings numbers are Social Blade CPM-based estimates. Across the 904 channels with a positive lowest-band value, the median ratio between the high and low edges of the reported band is 16x and the 90th percentile is 16.2x. That is an order-of-magnitude uncertainty, not a rounding question. Actual creator revenue depends on sponsorships, merch, and content type in ways Social Blade cannot observe. The category ranking below the chart is meaningful as ordering. The absolute dollar levels are not.
Reproducibility note
Source, notebook, outputs at github.com/ndjstn/youtube-global-stats. Dataset: Global YouTube Statistics 2023 by Nelgiriye Withana on Kaggle (Nelgiriye Withana, 2023).