93,000 Customers and No Repeats: Olist Brazilian E-Commerce Analytics
Olist's 2016-2018 marketplace data shows 97 percent single-purchase customers. Revenue growth is all acquisition; retention is near-zero by construction.
Olist is a Brazilian marketplace. The public dataset carries 96,478 delivered orders across 93,358 unique customers from late 2016 through mid-2018, spread across nine CSV tables that join into a clean star schema. No machine learning in this project. The interesting work is joining the tables, building an RFM segmentation that a marketing team could actually use, and looking at cohort retention to answer the question every e-commerce operator wants answered: how many of these customers come back?
Almost none. Of 93,358 unique customers, 97 percent appear in exactly one delivered order during the window. The median order is R$ 105. The repeat-customer rate is 3 percent. First-order revenue accounts for R$ 15.0M of the R$ 15.4M total. Platform revenue growth through 2017-2018 is an acquisition story, not a retention story, and everything else in this post sits under that fact.
The cohort reality
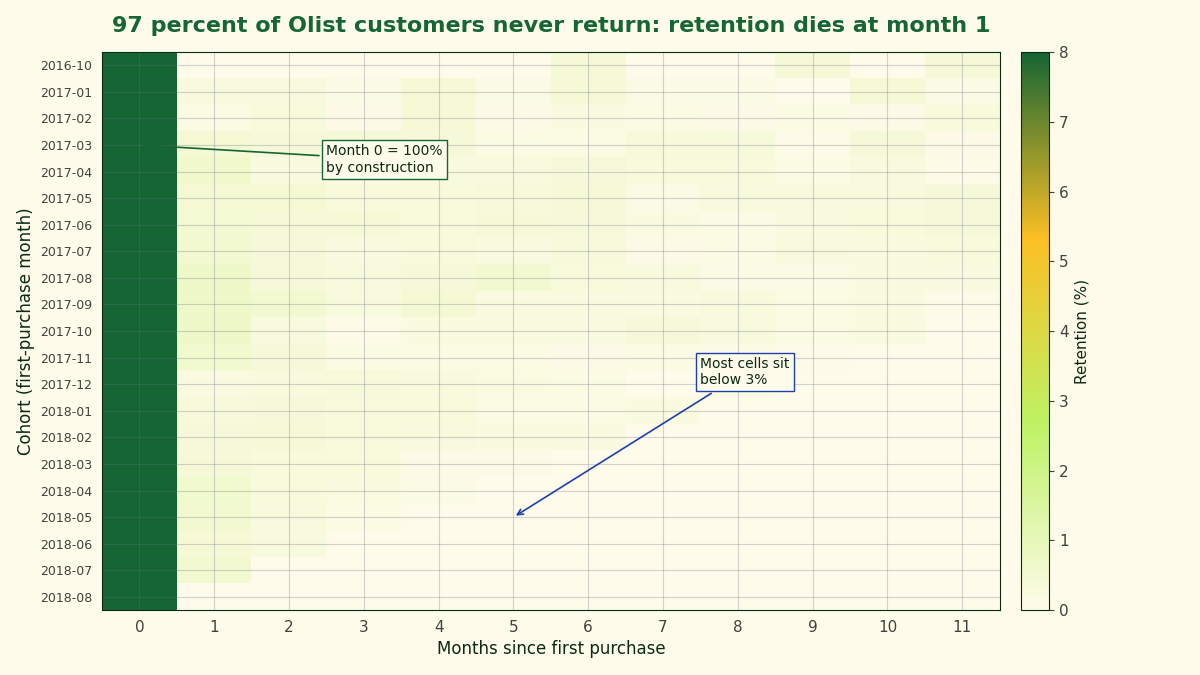
Row is the month a customer first purchased. Column is months since. Cell is the share of the cohort that ordered again in that month. Month 0 is 100 percent by construction. Months 1 through 11 are nearly dark — almost every cell sits below 3 percent retention.
This isn’t a retention problem, it’s a business model. Olist sells mostly one-time-purchase items — appliances, home goods, furniture, electronics. Customers come in when they need a specific thing, buy it, and don’t return until they need another specific thing, which may be years later.
For an operator looking at this data, the practical takeaway is that customer acquisition cost matters more than customer lifetime value, because LTV collapses to first-order value. With a median order of R$ 105, a repeat rate of 3 percent, and 1.14 items per order on average, the revenue function is almost a linear combination of new-customer count and median order size. Acquisition-channel efficiency and order-level economics, not retention levers, are where optimisation pays off on this data.
Watching retention build
The reveal builds the matrix the way an analyst computes it. The October 2016 cohort starts at 100 percent at month 0, then its retention walks rightward as the later months fill in with 3-percent-or-lower values. When row one finishes, the November 2016 cohort begins below it, and so on through August 2018. The point of watching it this way is that retention is conditional on the original cohort size; every cell is a percentage of the cohort that first ordered in that row’s month, not of the platform’s current active base.
Monthly revenue
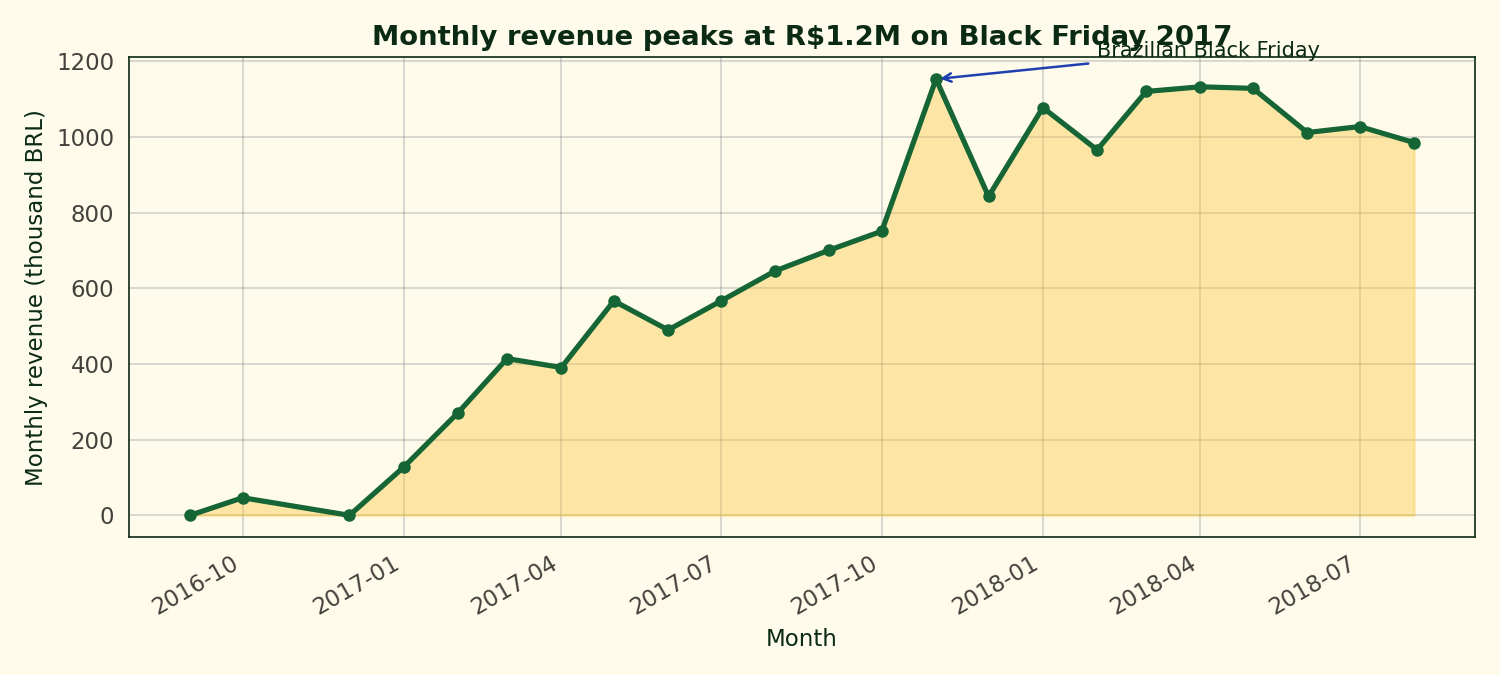
Revenue ramps from zero in late 2016 through Q1 2017 growth, a clear Black Friday spike in November 2017 at R$ 1.15M, and steady 2018 levels around R$ 1.0-1.1M per month. Total across the window: R$ 15.4M.
RFM segmentation
The segmentation uses the standard e-commerce scoring: each customer gets three scores from 1 to 5, one for each of recency, frequency, and monetary. The 1-to-5 scale comes from quintile binning on the rank. Rank every customer on a given axis, split the rank distribution into five equal-sized buckets, and assign scores 1 through 5. Ranking before binning matters because most Olist customers tie at frequency = 1, so qcut on the raw values would collapse to fewer than five distinct bins. The three scores combine into six named segments by a short rules table: high recency and high frequency becomes Champions, high recency but low frequency becomes New / Recent, and so on through At risk, Lost, Big spenders, and Others.
| Segment | Customers | Revenue (BRL) | Revenue/customer |
|---|---|---|---|
| Big spenders | 10,337 | 3,021,467 | 292 |
| Champions | 14,871 | 2,631,536 | 177 |
| At risk | 14,919 | 2,529,831 | 170 |
| New / Recent | 14,984 | 2,448,694 | 163 |
| Lost | 14,986 | 2,441,760 | 163 |
| Others | 23,261 | 2,346,486 | 101 |
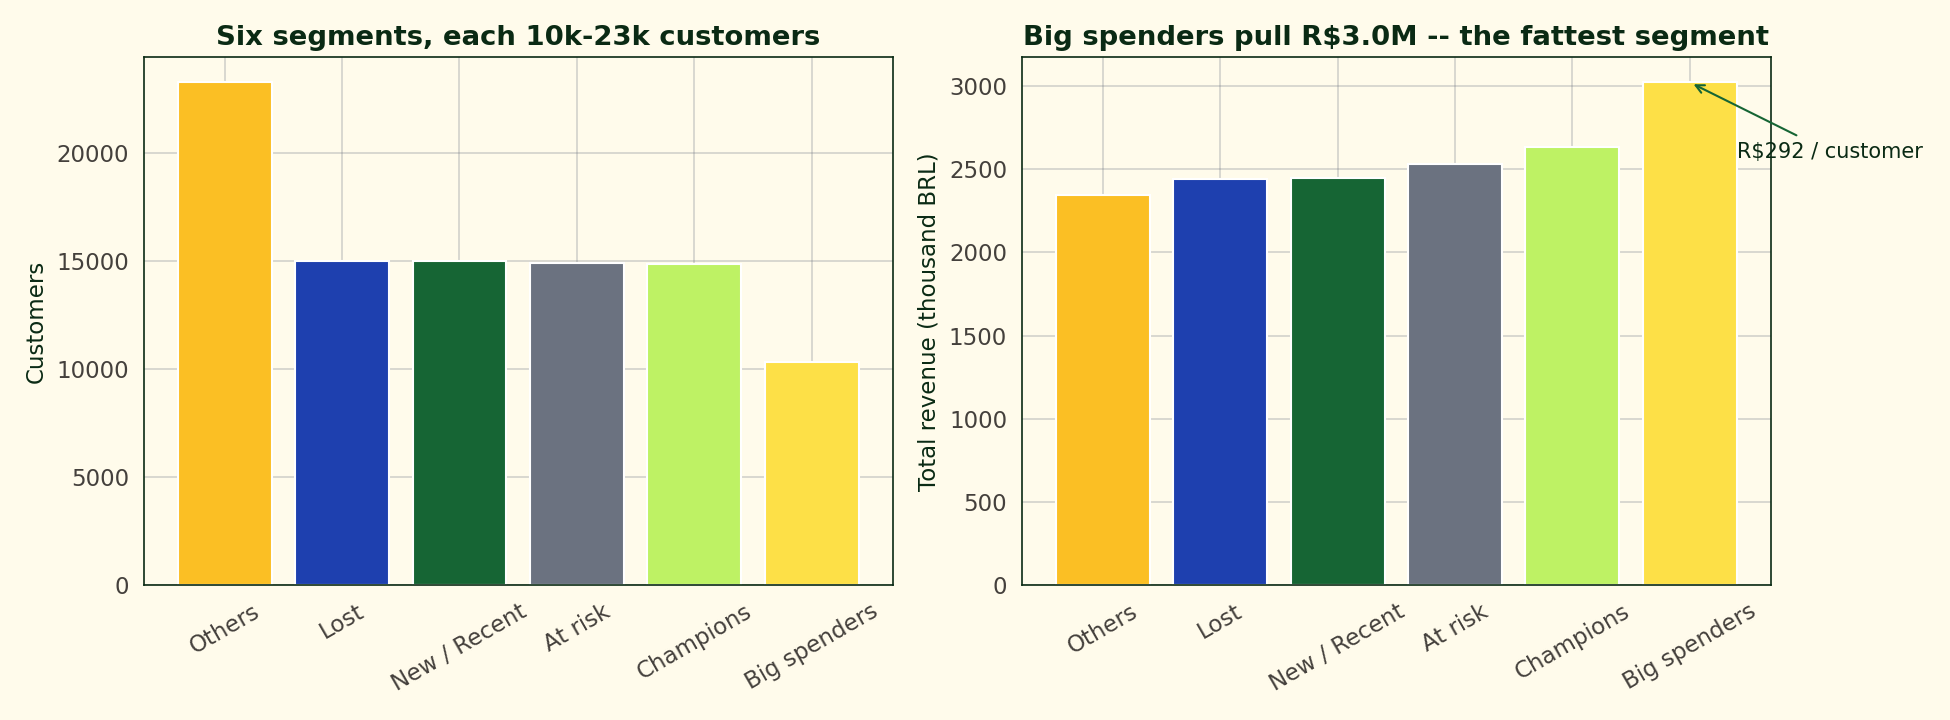
Big spenders is the smallest segment by count at 10,337 customers, but carries the highest revenue per customer at R$ 292, nearly three times the R$ 101 for Others. At-risk customers are where a retention program would point first — 14,919 historically frequent buyers who have gone dormant.
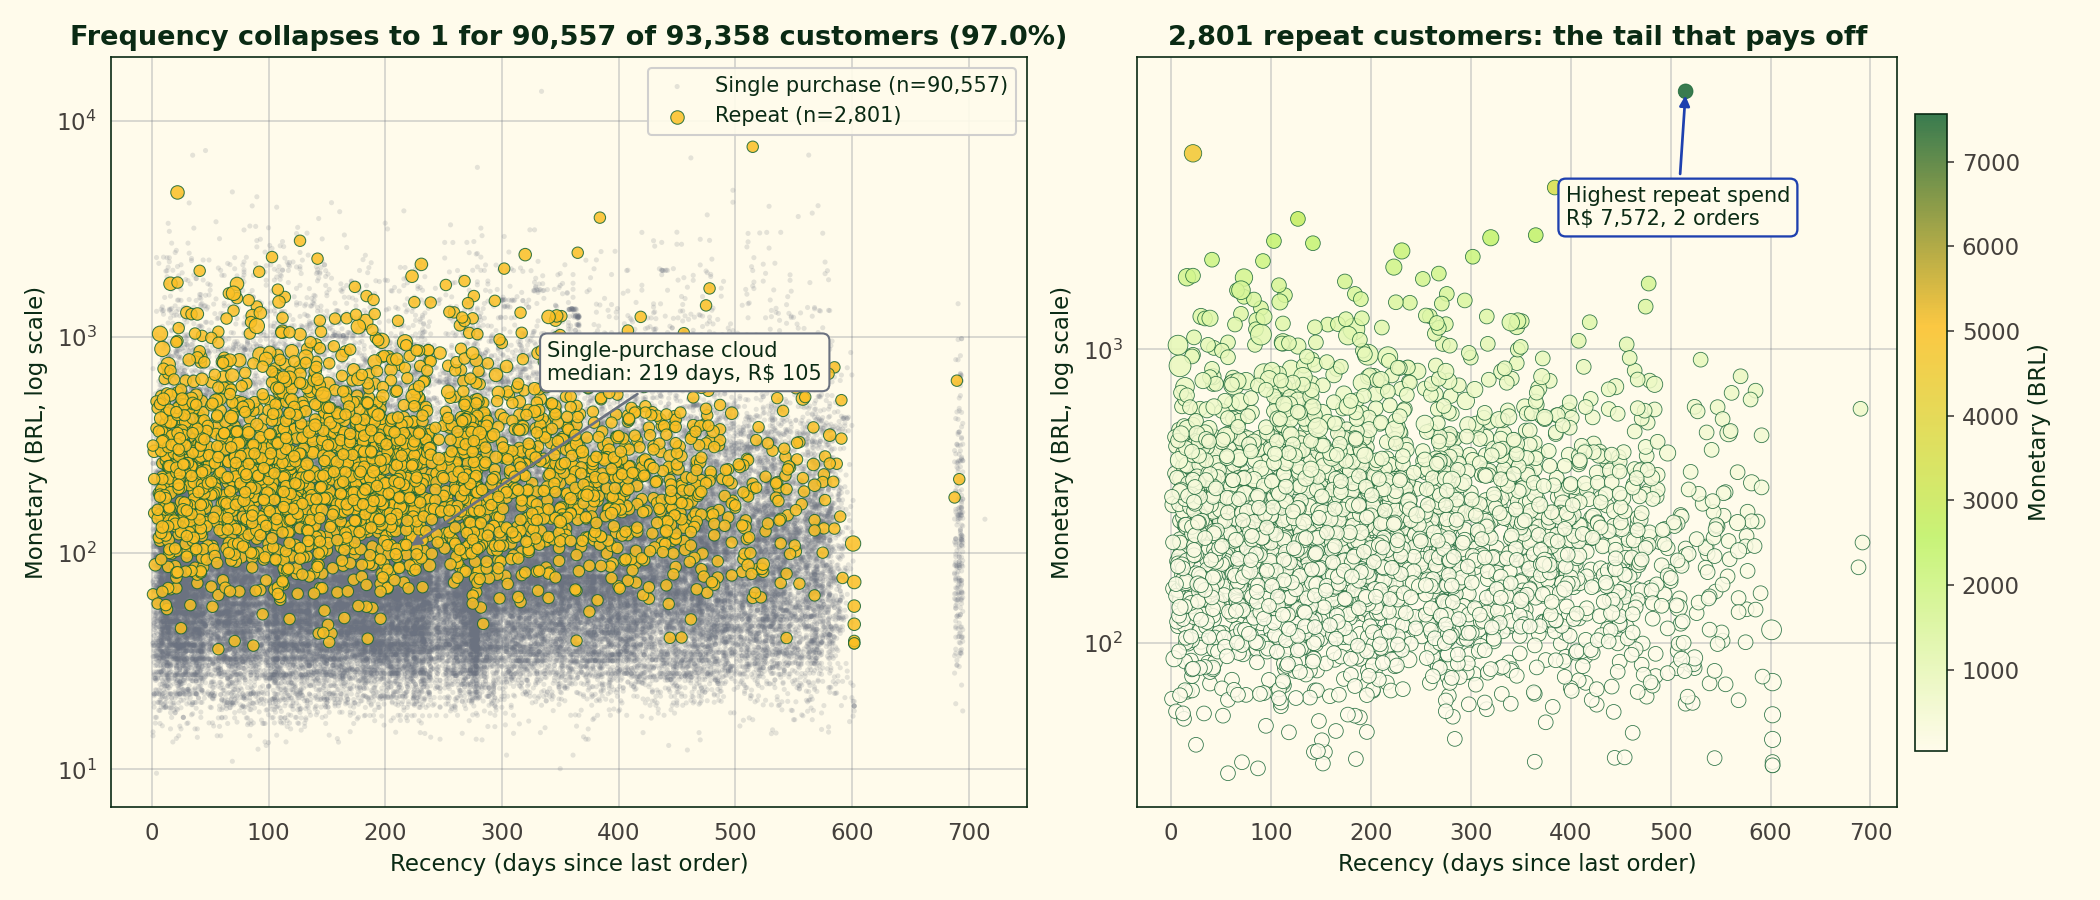
The left panel puts the 97 percent single-purchase cloud under the 2,801 repeat customers so the gold dots read as the minority they are. The single-purchase cloud medians 219 days of recency at R$ 105 monetary, tight and low. The right panel isolates the repeat tail and colours it by monetary — the spenders are spread across the full recency range, so a retention programme targeting repeats cannot just index on how recently someone last ordered.
Delivery time drives review scores
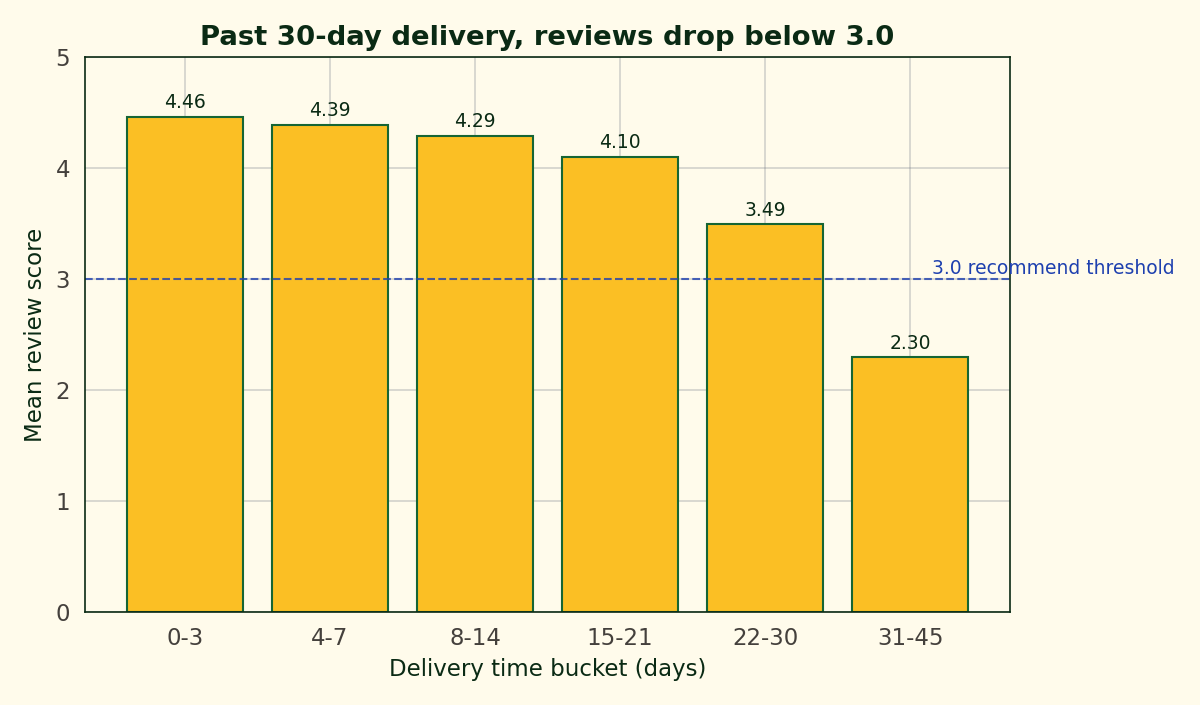
0-3 day delivery averages 4.46-star reviews. 15-21 days averages 4.10. At 22-30 days the mean is 3.49. Past 30 days the mean falls to 2.30, well below the 3.0 threshold where customers stop recommending a retailer. Brazilian geography makes 40-day delivery not rare in this data, and the cost shows up directly in the review distribution.
Revenue by state
São Paulo dominates every month by 2-3x over the next state. Rio, Minas Gerais, and Rio Grande do Sul form the next cluster. The ordering is stable — no state overtakes SP at any point in the observation window.
What this isn’t
Not a revenue forecast. The 2018 tail of the dataset is incomplete; the last-month numbers are partially a cutoff artifact.
Not a full LTV model. With 97 percent single-purchase customers, the usual LTV math collapses to first-order value plus a tiny tail. A full churn-model LTV is overkill for this data.
Not a vendor-economics analysis. Seller IDs are present but seller costs aren’t, so the margin side of the marketplace isn’t visible.
Reproducibility note
Source, notebook, outputs at github.com/ndjstn/olist-ecommerce-analytics. Dataset: Olist Brazilian e-commerce dataset on Kaggle (Olist, n.d.).