Contract Type Eats the Rest: Telco Customer Churn with SHAP
The IBM Telco churn dataset has 19 features and one of them does most of the work. SHAP ranks contract type first with a mean absolute impact of 0.88, and the raw churn rate across contract types agrees.

The IBM-style Telco customer churn dataset has 7,043 rows, 19 features, and a 26.54 percent churn rate. You can fit an XGBoost classifier on it in under a minute and get 0.83 ROC-AUC without tuning anything. That part’s not interesting. The interesting part is what happens when you point SHAP at the fitted model and ask which features the classifier is actually using.
The answer is almost embarrassing. One feature does most of the work. Contract type has a mean absolute SHAP of 0.880. The next feature is tenure at 0.538, and by the fifth-ranked feature the contribution is a factor of three below the top. For anyone who sat through a tutorial that treats churn modelling as a balanced feature-importance exercise, the SHAP bar chart is a reality check.
The setup
Before explaining the model I want to be clear about what this dataset is. It’s a sample originally produced by IBM for their product demos and redistributed through Kaggle by user blastchar. No date stamps, no geographic information, no cohort identifiers. Rows are residential customers of a hypothetical operator, and the 26.54 percent churn rate is high enough that it may have been oversampled from an underlying dataset with a lower base rate. Those are real limitations, and the conclusions below should be read with them in mind.
With that noted, the quick profile:
| Item | Value |
|---|---|
| Rows | 7,043 |
| Features | 19 |
| Positive (churn) | 1,869 |
| Positive rate | 26.54% |
| Feature groups | demographics, services, account |
Two preprocessing notes. TotalCharges arrives as a string column because of 11 rows with blank values; I coerced to numeric and median-imputed. customerID carries no signal, so I dropped it. Everything else passes through XGBoost with enable_categorical=True, which handles the sixteen categorical columns natively.
The model
Five hundred trees, depth 4, learning rate 0.05, scale_pos_weight set to the empirical negative-to-positive ratio, 75/25 stratified split.
Test-set numbers:
| Metric | Value |
|---|---|
| ROC-AUC | 0.8328 |
| Average precision | 0.6387 |
| F1-optimal threshold | 0.54 |
| Precision at F1-best | 0.548 |
| Recall at F1-best | 0.715 |
| F1 | 0.621 |
Nothing remarkable. A retention team operating the model at the F1-optimal threshold catches roughly seven of every ten customers who will churn, and between five and six of every ten flags land on an actual churner. That’s the envelope a retention program would design around.
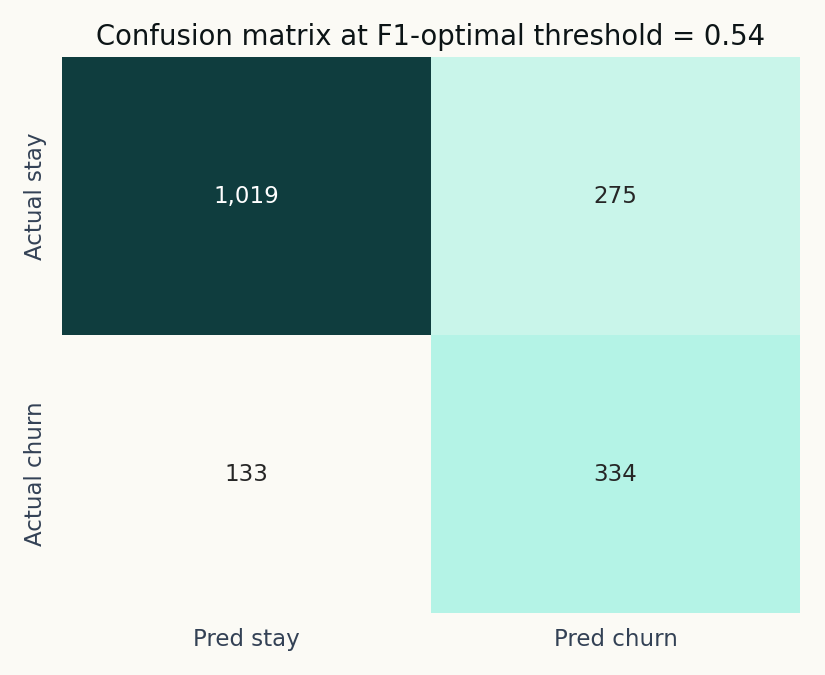
The model misses 133 actual churners out of 467 in the test set and flags 275 customers who’ll stay. That’s the tradeoff the F1 optimiser found; a retention team might choose to recalibrate in either direction.
So what does moving the threshold cost us? I ran a sweep from 0.05 to 0.95 and animated the effect on the predicted-probability histogram.
Watching the threshold slide lets you feel the recall/precision tradeoff rather than just read it off a table. At threshold 0.3, recall is near 0.9 and precision drops. At 0.7 the numbers flip.
Contract type eats the rest
This is where the project departs from a standard churn tutorial. Most tutorials stop at the feature importance bar from model.feature_importances_, which is a split-count proxy and doesn’t tell you the sign or magnitude of the effect on an individual prediction. SHAP does both.
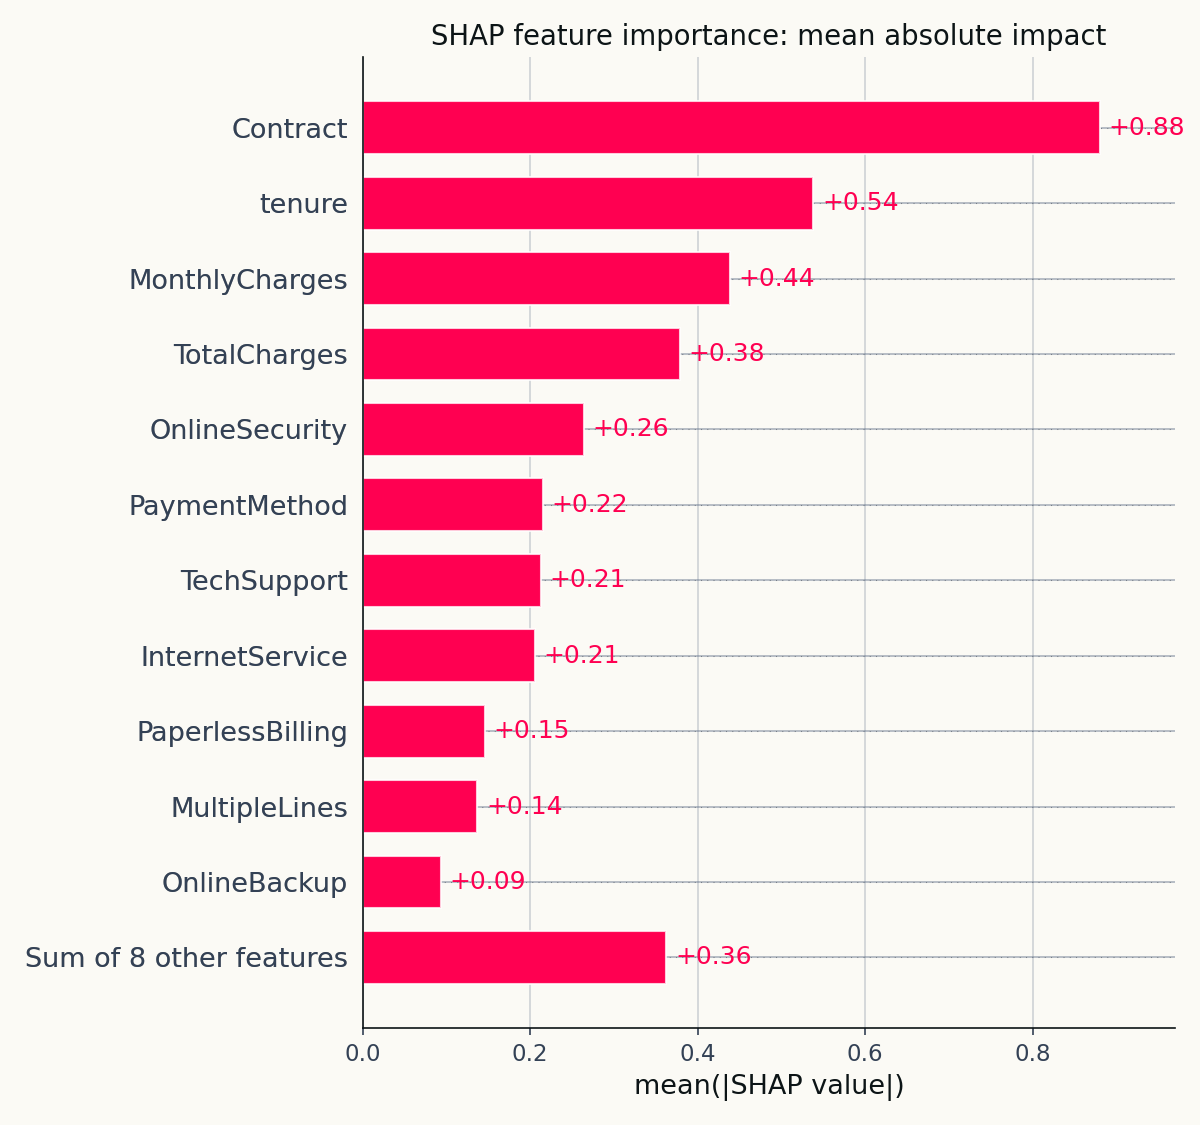
Mean absolute SHAP over the 1,761-row test set. Contract type leads by a factor of 1.6 over tenure and by a factor of three over the fifth-ranked feature.
The top three are contract, tenure, and monthly charges. Everything else is rounding error by comparison.
The raw data confirms the ranking. The 3,875 month-to-month customers churn at a 42.71 percent rate. The 1,473 one-year customers churn at 11.27 percent. The 1,695 two-year customers churn at 2.83 percent. Fifteen to one between the extremes.
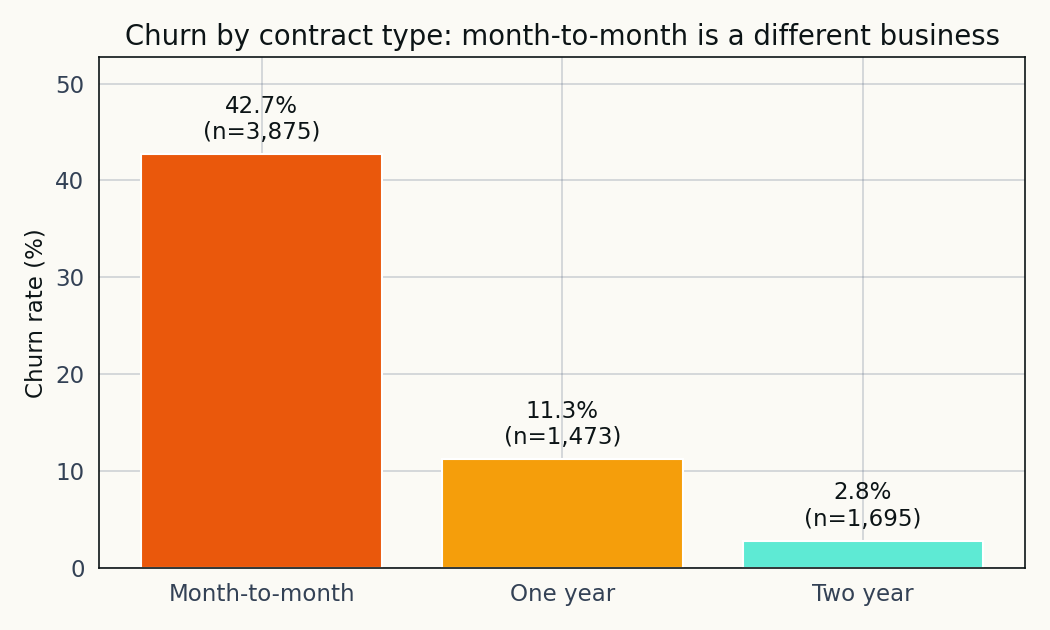
A two-line group-by in pandas already tells you most of what the model is going to learn. The SHAP ranking just confirms the model has the right priority.
The practical reading is that contract type is closer to a business-model variable than to a customer attribute. A customer who signs a two-year contract is, by the act of signing, a customer the operator has already retained for two years. The churn rate difference between contract tiers isn’t entirely a fact about the customers; it’s partly a fact about the product structure the operator offers.
Tenure is the second story

The cleanest single figure in the project. Below a tenure of about twelve months, the SHAP contribution to the churn score is strongly positive. Between twelve and thirty-six months, it drops through zero. Above thirty-six months, it stabilises at a meaningfully negative contribution.
Tenure is the second-strongest feature at mean absolute SHAP 0.538, and the dependence plot shows how the model uses it. A customer in their first year gets pushed toward the churn side by around 0.7 to 1.0 log-odds; a customer past three years gets pulled toward the stay side by 0.5 to 0.8. The transition is gradual, which is the expected shape of a hazard function that decays with tenure.
The colouring by MonthlyCharges adds a secondary layer: at short tenure, higher monthly charges amplify the churn risk; at long tenure, the effect attenuates. New customers on premium plans are the highest-risk cohort.
The cohort view on the raw data makes the contract-plus-tenure story immediate.
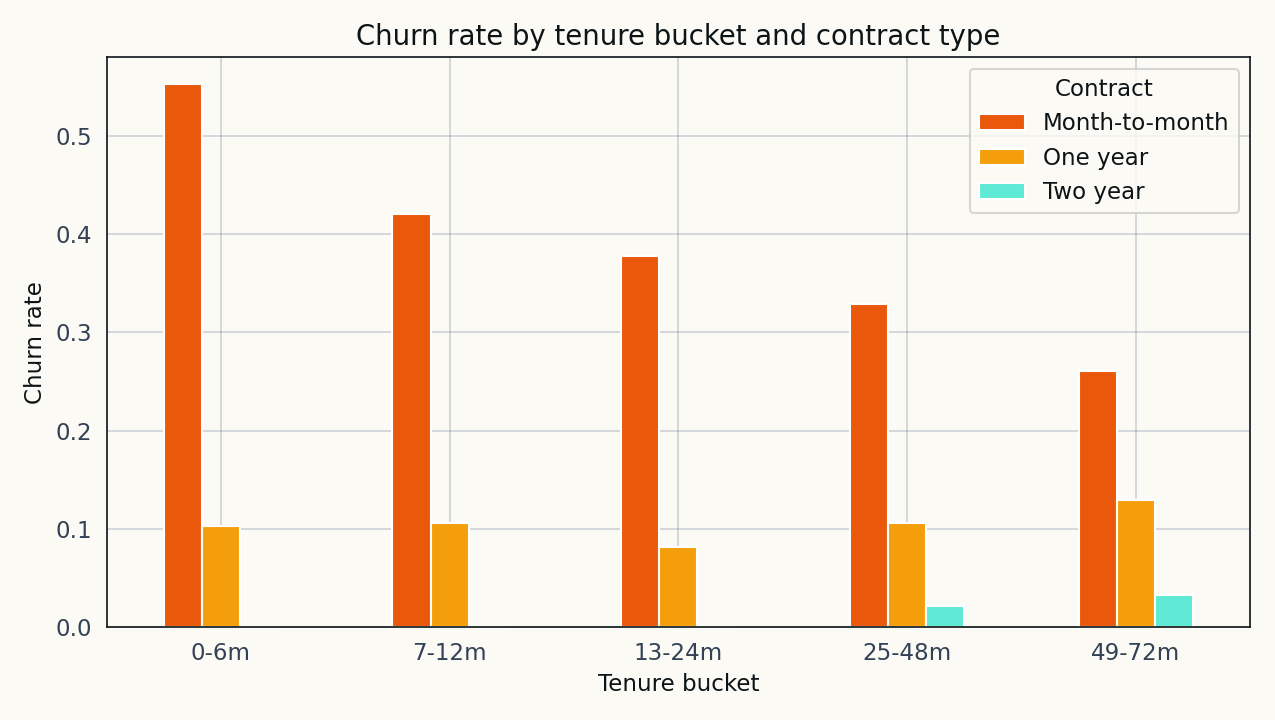
The two features compound rather than add. A new month-to-month customer is in a different world from a long-tenure two-year customer, and the model captures the difference accurately.
Four customers, four waterfalls
SHAP’s reputation as an explainability tool is partly earned on the global charts above, but the real operational payoff is the per-customer waterfall.
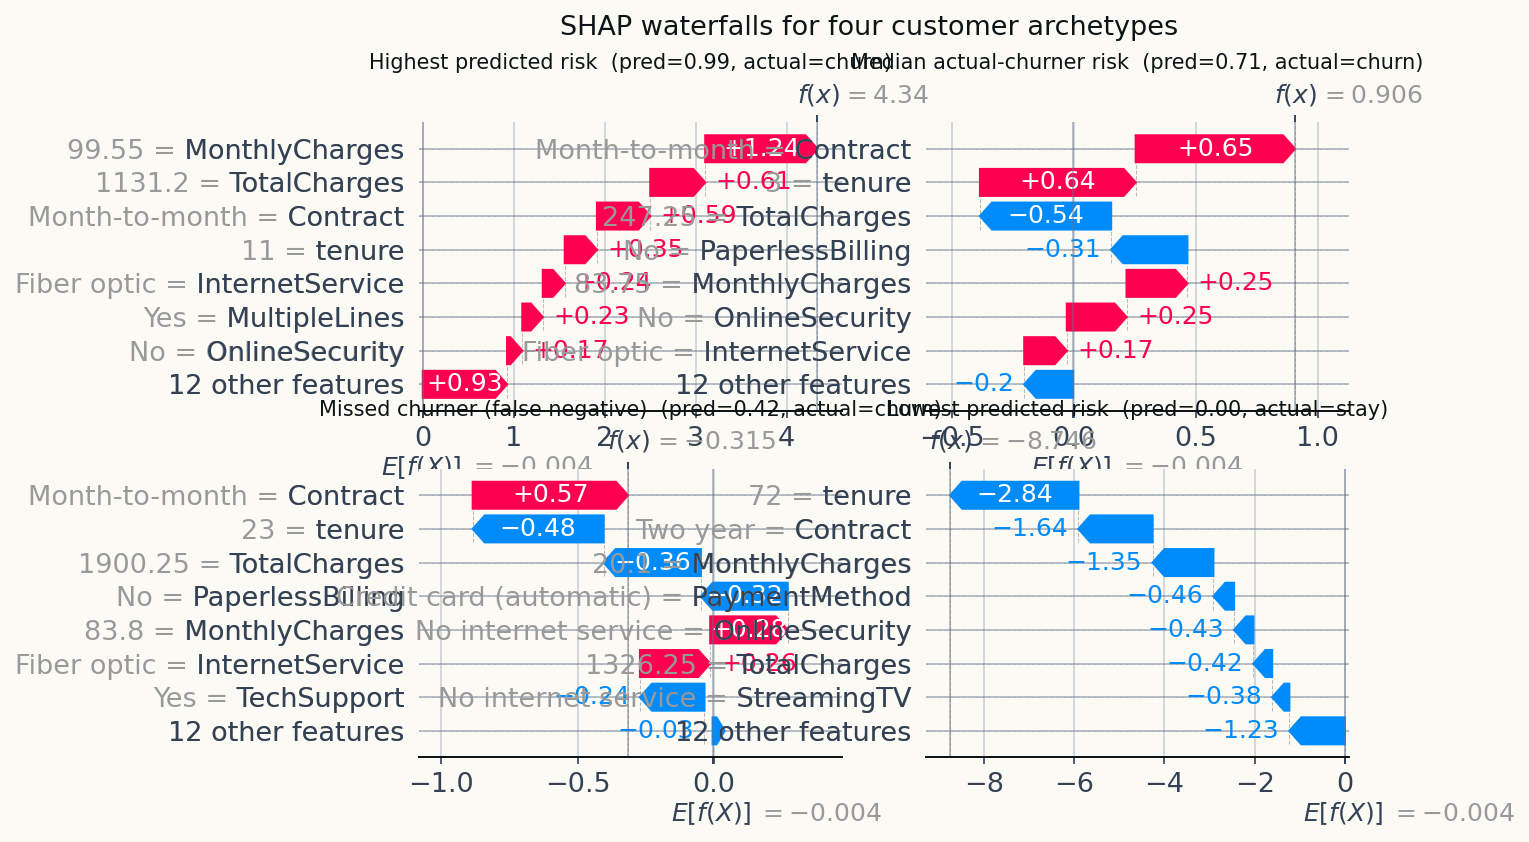
Four archetypes on the same figure. Top-left: the customer the model is most confident will churn. Top-right: a median actual-churner, which lets you see what a “realistic” positive looks like. Bottom-left: a missed churner (false negative) showing why the model was wrong. Bottom-right: the lowest-risk customer, for contrast.
The missed-churner panel is the one I’d put in front of a retention team. The model assigned it a low probability, the customer churned anyway, and the waterfall shows which features pushed the prediction low. That’s the failure mode the retention team needs to handle manually — the model rank-orders well but isn’t perfect at the margin, and showing them which features the model underweighted lets them layer a simple rule on top.
A score alone tells the retention team whom to call. The waterfall tells the agent what to offer.
What this isn’t
The model doesn’t prove that contract type causes lower churn. It shows that contract type is the strongest predictor of churn in the observed data. Customers who sign two-year contracts are a different population than those who sign month-to-month ones, and the lower observed churn among the former partly reflects the selection effect rather than a causal benefit of the contract itself. Pinning the causal fraction down would need an experiment.
SHAP values are a local attribution, not a causal decomposition. A feature with a large SHAP contribution tells you what the model used, not what would happen if you intervened on the feature. “Upgrade this customer to a one-year contract” is a defensible retention hypothesis from the SHAP output, but it needs a randomised holdout to validate.
And the dataset is what it is. Thin provenance, a high base rate that may not reflect the operator’s real churn, no dates, no geography. The methodology generalises; the specific numbers shouldn’t be quoted out of context.
Reproducibility note
Everything here runs end-to-end from the Kaggle CSV through preprocessing, the XGBoost fit, the SHAP pass, and the figure generation. The narrative version lives at notebooks/telco-churn-shap-analysis.ipynb; the single-script version is src/run_analysis.py. Source code, notebook, and outputs are in the public repository at github.com/ndjstn/telco-churn-shap. The dataset is the WA_Fn-UseC_-Telco-Customer-Churn.csv file from the blastchar Kaggle dataset (blastchar, n.d.).