Room Type First, Geography Second: Airbnb NYC 2019 Price Modelling
A gradient-boosted price model on the 2019 NYC Airbnb snapshot reaches R^2 0.62 and MAE under $50. Sixty-two percent of the splits are about room type, not location.

The 2019 NYC Airbnb dataset has 48,895 listings across the five boroughs with coordinates, room type, nightly price, and enough supporting features to build an honest price model on. A gradient-boosted regressor on the filtered data reaches an R-squared of 0.619 on log price and a mean absolute error of 49.79 USD per night. Adding five landmark-distance features to a ridge baseline buys 3.8 percentage points of R-squared. Moving from ridge to gradient boosting buys another 6 points.
None of those numbers are the interesting part. The interesting part is the feature ranking. Fifty-two percent of the splitting decisions in the ensemble are driven by a single indicator: is this a private room. Another ten percent are driven by whether it is a shared room. That is 62 percent of the model’s decision-making about room type before any geography gets considered. The highest-ranked spatial feature is distance to Times Square at 14.8 percent.
Short version: on this dataset, a listing is first of all a product category and only secondarily a location.
The dataset
The file is the 48,895-listing 2019 Airbnb NYC snapshot published by Dgomonov on Kaggle. Each row is a listing with borough, neighborhood, coordinates, room type, price, minimum nights, review counts, host listing count, and availability.
I filtered to prices between 1 and 2,000 USD per night, which drops 97 rows — a handful of zero-price entries that look like data-entry errors plus a long thin tail of listings priced at 5,000 USD and up that appear to be either scraping mistakes or listings where the price is not operative. I transformed the target to log(price + 1) before modelling, which stabilises both the residual distribution and the model comparison across a strongly right-skewed distribution.
Post-filter there are 48,798 listings with a median price of 105 USD and a mean of 145.53 USD. The five-borough breakdown matches New York priors: Manhattan median 150 USD, Brooklyn 90 USD, Queens 75 USD, Staten Island 75 USD, Bronx 65 USD.
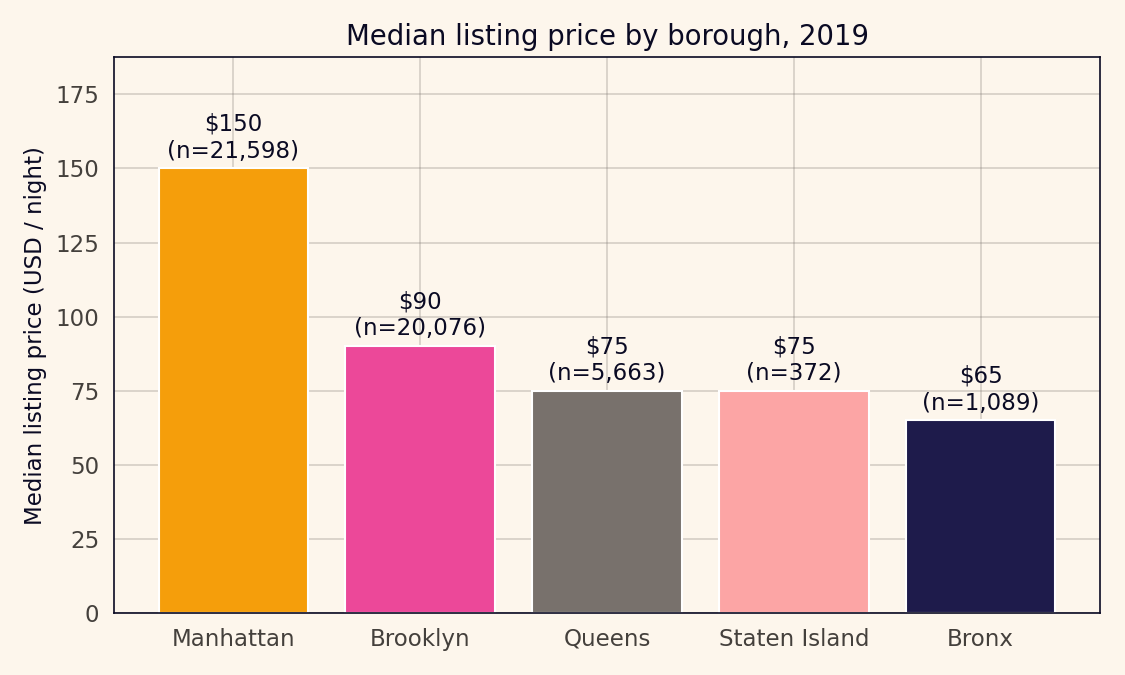
Borough medians in 2019. The ratio between Manhattan and the Bronx is roughly 2.3x, which is narrower than the rent ratio because Airbnb listings tilt toward entire apartments in Manhattan and private rooms in outer boroughs.
Engineering distance features
The listings come with coordinates, which means the modelling question is how to use them. Dropping raw latitude and longitude into a ridge model and letting it sort out the geography is the baseline move. It works to a point, but it discards structure: the decline in price with distance from Manhattan is a gradient, not a grid pattern, and a ridge model with raw coordinates cannot represent that gradient well.
Landmark distances encode it directly. I added Haversine distances from each listing to five landmarks: Times Square, Brooklyn Bridge, LaGuardia Airport, Central Park South, Prospect Park. The specific landmark set matters less than the act of adding them; the five I picked span the geographic range of the listings and capture the main centers of tourist demand and travel infrastructure.
Three models on the same split
A baseline ridge using only the basic listing columns plus borough and room-type dummies. A spatial ridge that adds the five landmark distances and raw coordinates. A gradient booster using the full spatial feature set.
| Model | R-squared on log price | MAE (USD) |
|---|---|---|
| Baseline Ridge | 0.5207 | 54.77 |
| Spatial Ridge | 0.5585 | 53.33 |
| Gradient Boosting | 0.6190 | 49.79 |
Adding spatial features moves the ridge R-squared from 0.521 to 0.559 — a real improvement, but not the largest jump in the table. Moving to gradient boosting on the same feature set takes R-squared to 0.619 and cuts MAE by another 3.54 USD. The combined improvement over baseline is 9 percent on MAE, which is a reasonable headline for a three-feature-group comparison.
Room type dominates
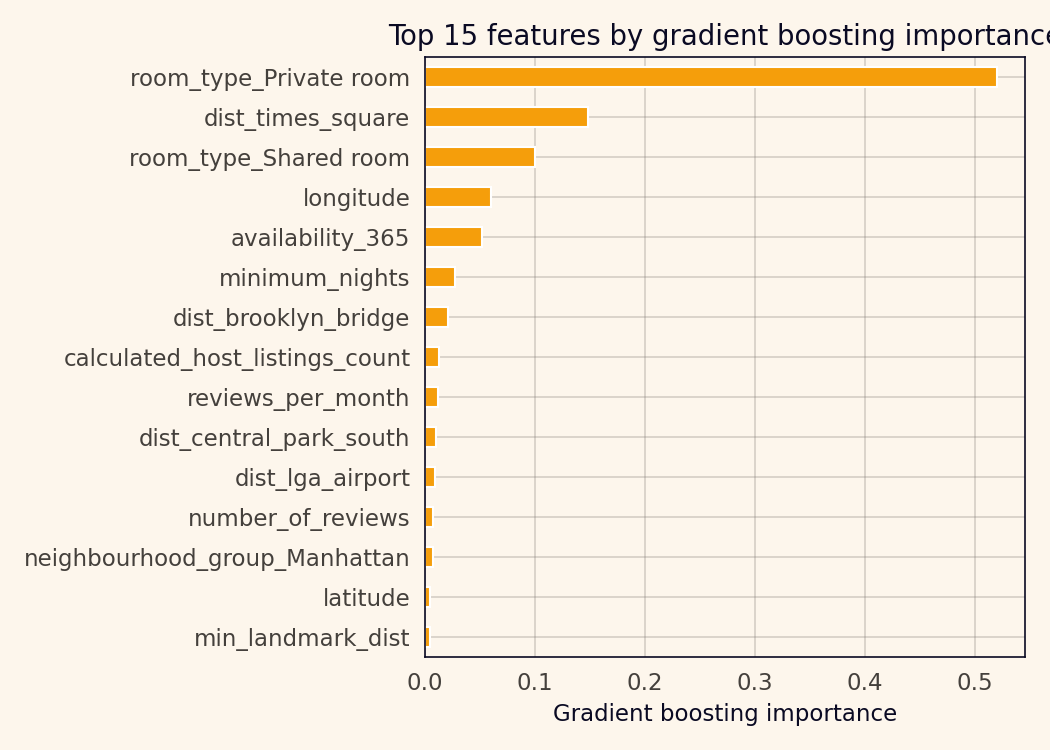
Gradient-boosting feature importance over the 15 top-ranked features. Room type indicators carry 62 percent of the decision weight; the first distance feature sits at 14.8 percent.
Fifty-two percent on the private-room indicator is not a subtle finding. The raw medians agree: entire home / apartment is 160 USD per night, private room is 70 USD, shared room is 45 USD. Before the model considers any other feature, the listing’s product category determines a two-to-three-times price band.
The practical reading is that Airbnb NYC in 2019 ran two overlapping businesses on the same platform. The entire-home market skewed Manhattan and Brooklyn, priced like a short-term hotel alternative, and accounted for 52 percent of listings. The private-room market skewed outer borough, priced like a premium spare bedroom in a shared apartment, and accounted for 46 percent. The gradient booster’s 62-percent feature weight is not a modelling artifact; it is a reflection of how different those two businesses are.
Geography matters, second
Within a room-type category, geography still matters.
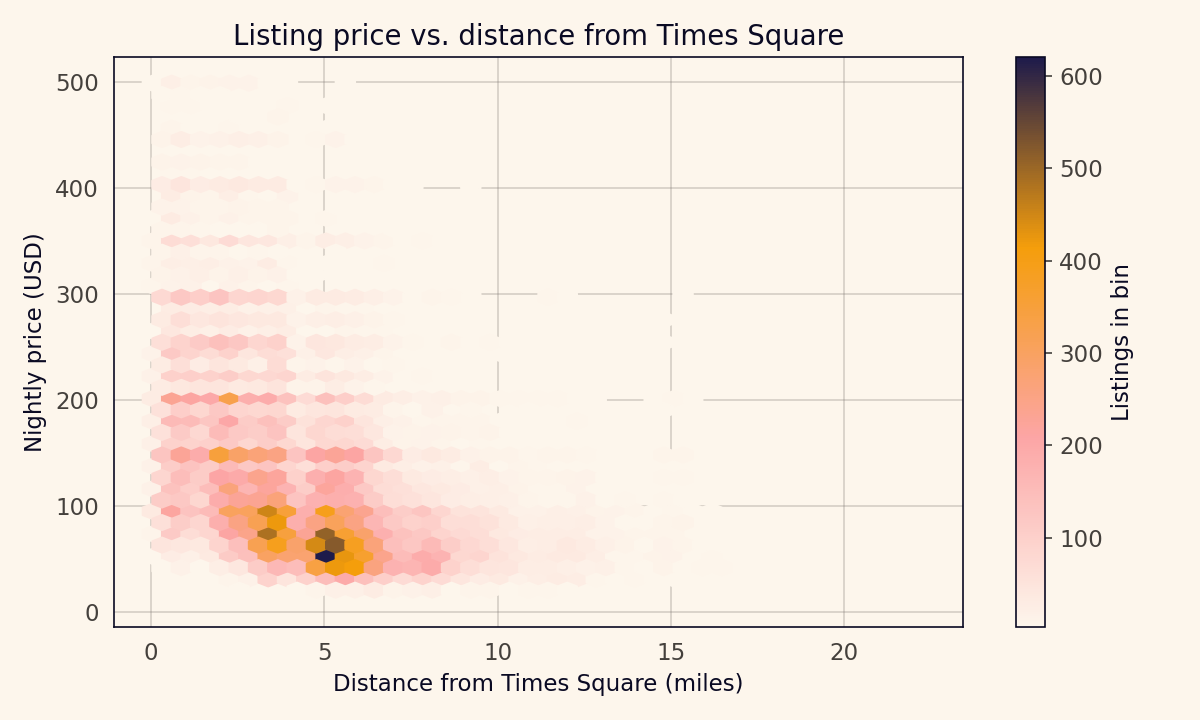
Prices fall with distance from Times Square. The gradient is closer to logarithmic than linear, which is why the log-price target fit better than raw price.
Under one mile from Times Square, a dense band of listings sit at 150 to 400 USD per night. Beyond three miles the band moves to 60 to 150 USD. Past six miles — the outer boroughs — the band sits at 50 to 120 USD. The decay is logarithmic.
The borough-by-room-type table tells the same story differently.
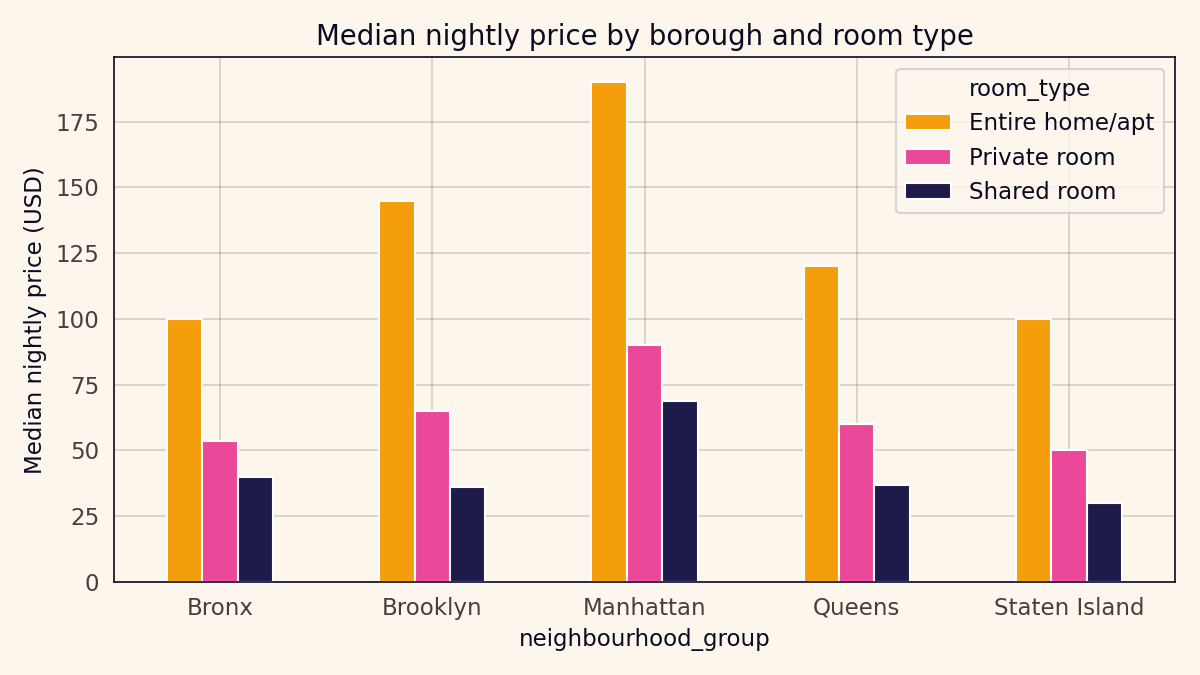
Room type and borough multiply rather than add. Manhattan’s entire-home premium over the Bronx is about 2x within that category; the premium on private rooms between the two boroughs is also about 2x.
The two price dimensions compound. The gap between Manhattan and the Bronx for entire homes is roughly 2x. The gap between Manhattan and the Bronx for private rooms is also roughly 2x. They are not additive; a Bronx private room is not a Manhattan entire home minus a discount. It is a different product at a different location.
An interactive map
An interactive Folium heatmap of listing density weighted by price, overlaid with markers for the ten most-expensive high-volume neighborhoods, is bundled in the public repo as figures/nyc-price-map.html. The static figures above carry the model’s finding; the map carries the spatial texture. The dense yellow cluster over Midtown and the West Village shows the core of the premium-listing market; the paler bands in outer Brooklyn and Queens show where the private-room listings concentrate; the Staten Island scatter shows how thin the market is outside the main four boroughs.
The ten markers land on Tribeca at 290 USD median, Midtown at 210, Financial District and West Village at 200, Chelsea at 199, SoHo at 198, and the rest of the top ten also in Manhattan. The top ten neighborhoods by median price are all in Manhattan once the minimum-listing threshold is applied, which is itself a finding the raw data makes visible.
What this is not
This is a price-estimation project, not a yield prediction. I modelled listed prices, not realised booking revenue. An 800-USD listing that books ten nights a year earns less than a 150-USD listing that books 200 nights. Occupancy rate, cancellation rate, cleaning fees, and seasonal demand all sit outside the snapshot.
The dataset is a 2019 snapshot. Short-term rental economics in NYC changed materially after Local Law 18 took effect in September 2023, which restricted most short-term rentals to hosted stays under 30 days and shrank the listing count by roughly two-thirds. A model trained on this dataset does not describe the 2026 market, and the price numbers in this post should be read as 2019 numbers.
Feature importance from a gradient booster is a splitting-count proxy, not a causal decomposition. Room type has a 52-percent importance because the ensemble uses it as the first split far more often than any other feature, not because room type causes 52 percent of price variation. The distinction matters if anyone wants to read these numbers as policy guidance.
Reproducibility note
Everything here runs end-to-end from the Kaggle CSV through the spatial feature engineering, the three model fits, and the figure generation including the interactive Folium map. Source code, notebooks, figures, and the generated map are in the public repository at github.com/ndjstn/airbnb-nyc-price. The dataset is the AB_NYC_2019.csv file from the Kaggle Dgomonov dataset (Dgomonov, 2019).