Ranking 528,000 FDA Adverse Event Reports by Hospitalization Risk
A supervised model on a 528,000-row cleaned FAERS extract, reframed as a queue-ranking problem rather than a classifier. Random forest reaches PR-AUC 0.759 and recall 0.730 on hospitalization after six outcome-bearing fields are excluded to prevent leakage.
The FDA’s Adverse Event Reporting System collects hundreds of thousands of drug-related reports every year, and pharmacovigilance reviewers cannot open every one with equal depth. Triage is already happening at every safety team on Earth that works with spontaneous reporting data. It just happens informally — shaped by reviewer intuition, coarse severity codes, and the order in which reports arrive.
This project reframes that informal triage as an explicit ranking problem. Given a cleaned FAERS report, how likely is it to involve a hospitalization? A model that produces a usable ranking lets a reviewer open the highest-risk reports first. Nothing about that is a diagnosis. Nothing about that is a causal claim. It is a sort layer that makes the triage decision legible enough to be audited, revised, and measured.
The model that came out of the work reaches PR-AUC 0.759 and recall 0.730 on the hospitalization target. The work that matters more than those numbers is the part where I figured out what the features were actually measuring.
The shape of the problem
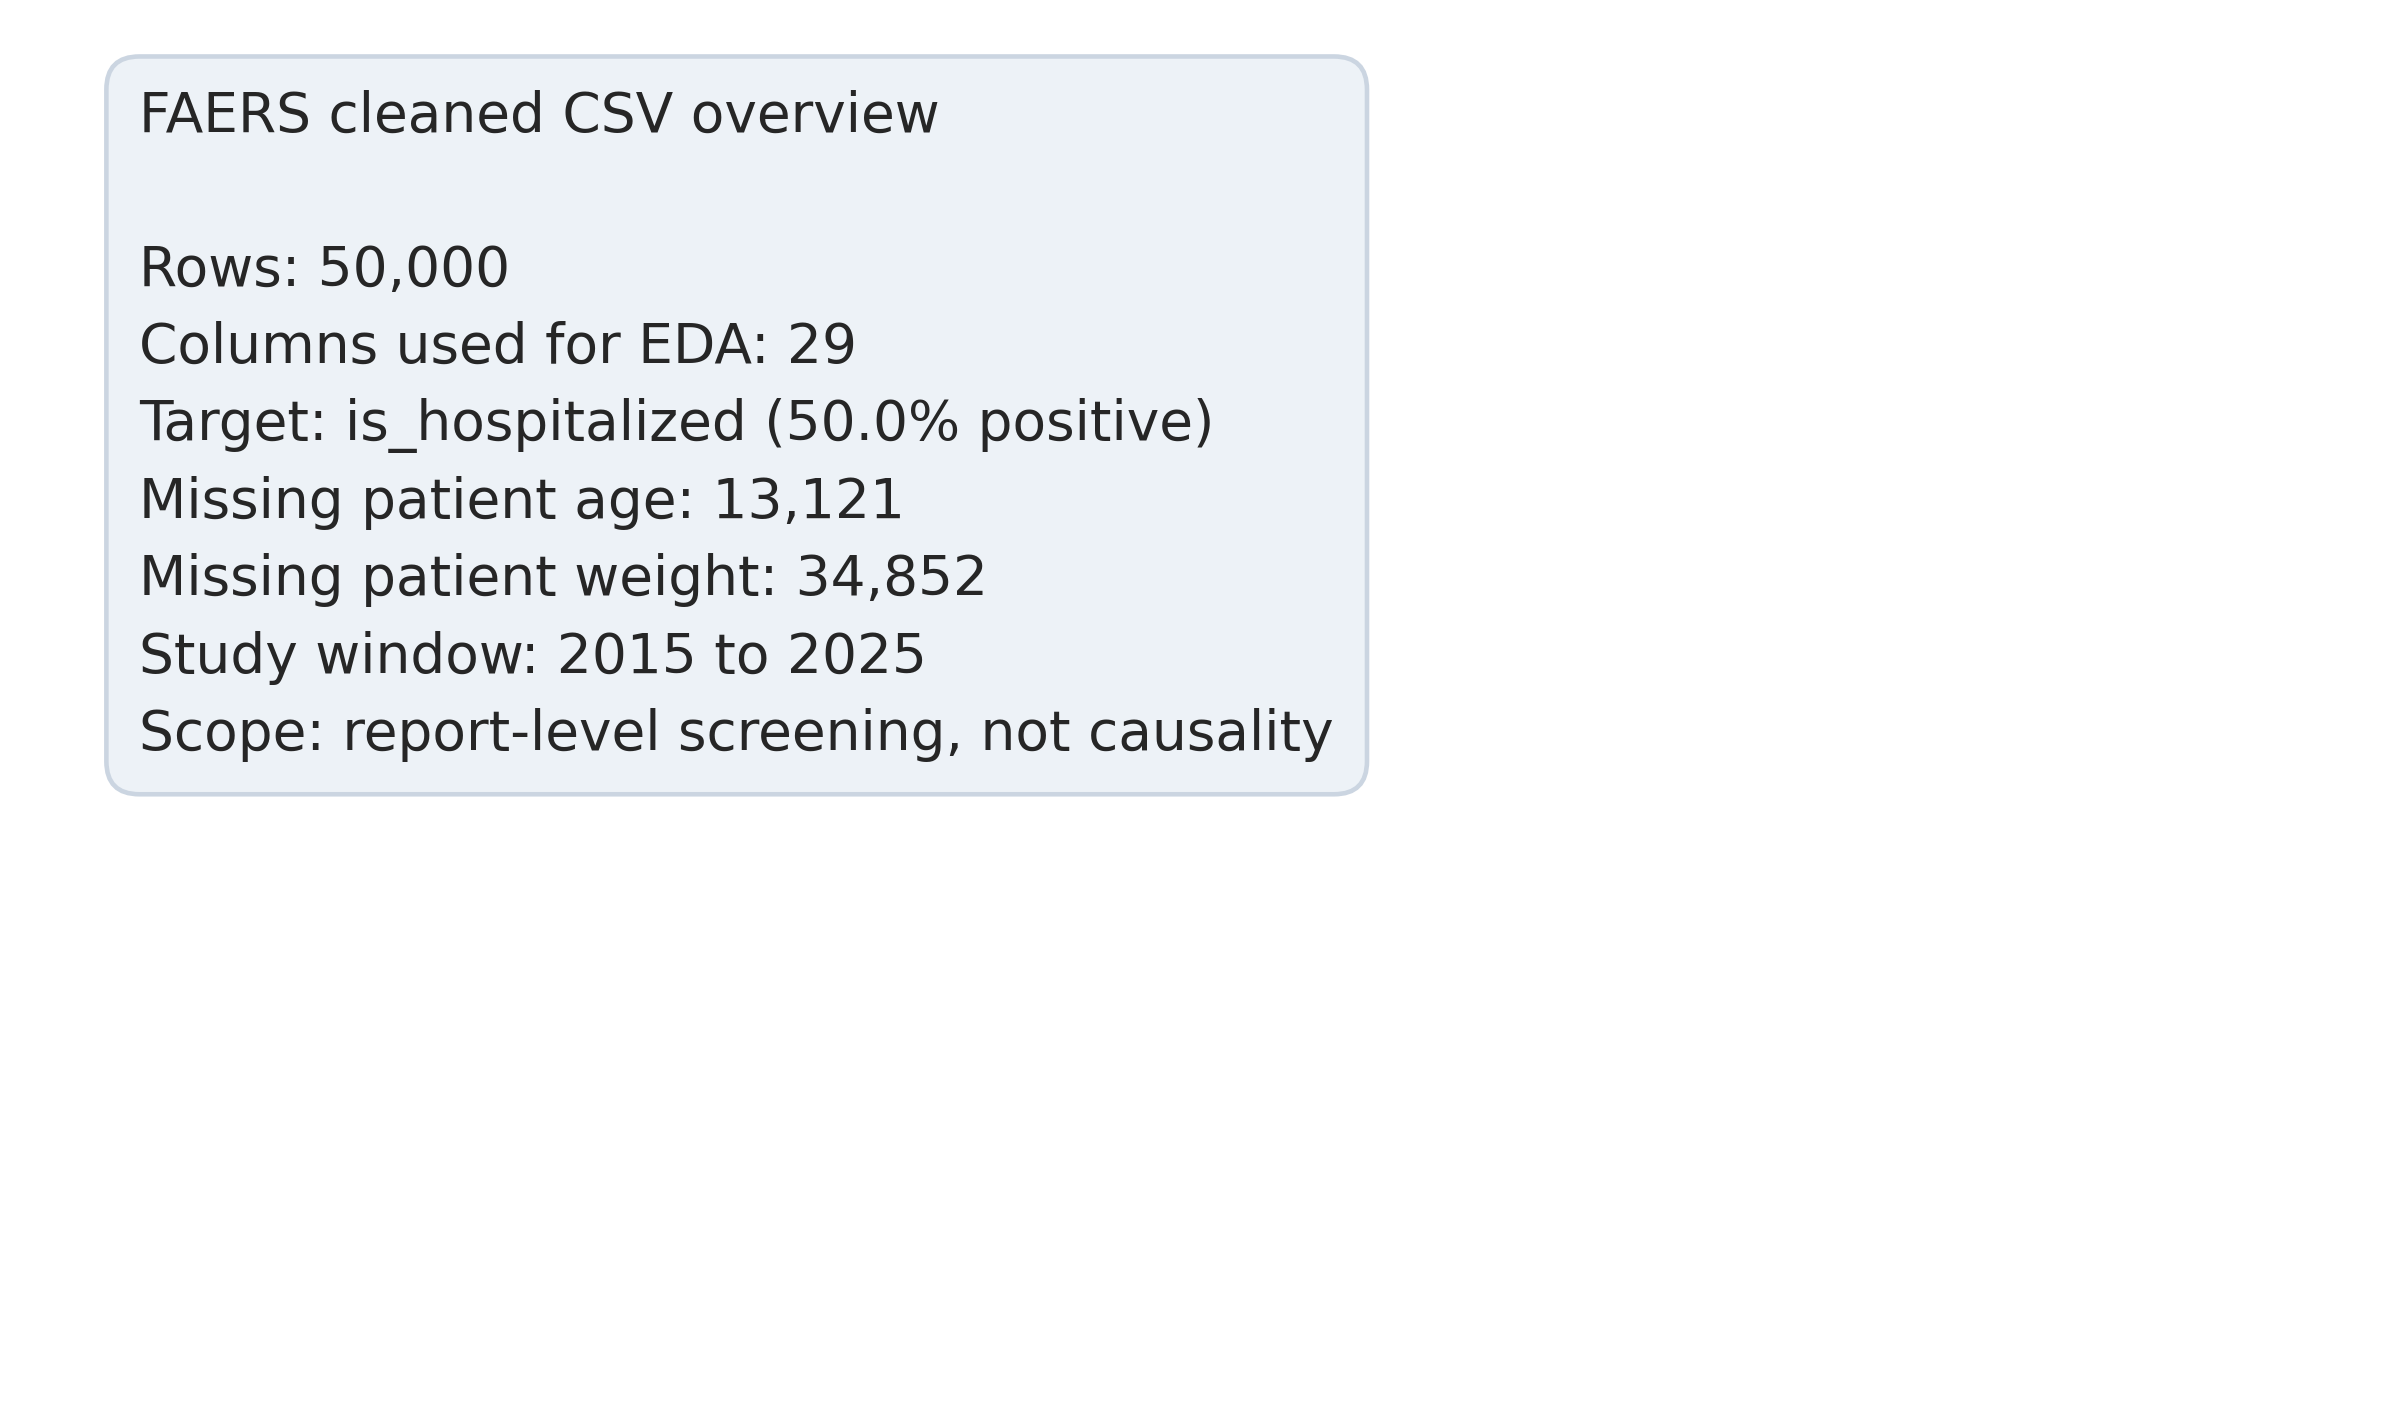
The cleaned extract used here holds 528,000 reports across eleven reporting years, from 2015 through 2025. That size matters for two reasons. It is large enough to train a supervised model cleanly, and it is a small enough slice of the overall FAERS corpus that nothing in this analysis should be read as a population claim about adverse drug reactions generally. The system is voluntary and the reporting population is self-selected; FAERS carries no denominator. The number of patients who took a drug and did not report an event, or did report one through a different channel, is not in the data (FDA, n.d.).
The problem is not about diagnosing patients. It is about ordering a review queue. The triage score sits between intake and the human reviewer, and every downstream action still runs through the reviewer.
The target variable is whether the report involves a hospitalization. Hospitalization is operationally actionable — a reviewer who sees that a report has a high predicted hospitalization probability has a specific reason to pull it forward in the queue. The broader “seriousness” flag mixes hospitalization with disability, life-threatening events, death, and a residual category, and predicting that heterogeneous aggregate does not map cleanly onto a triage decision.
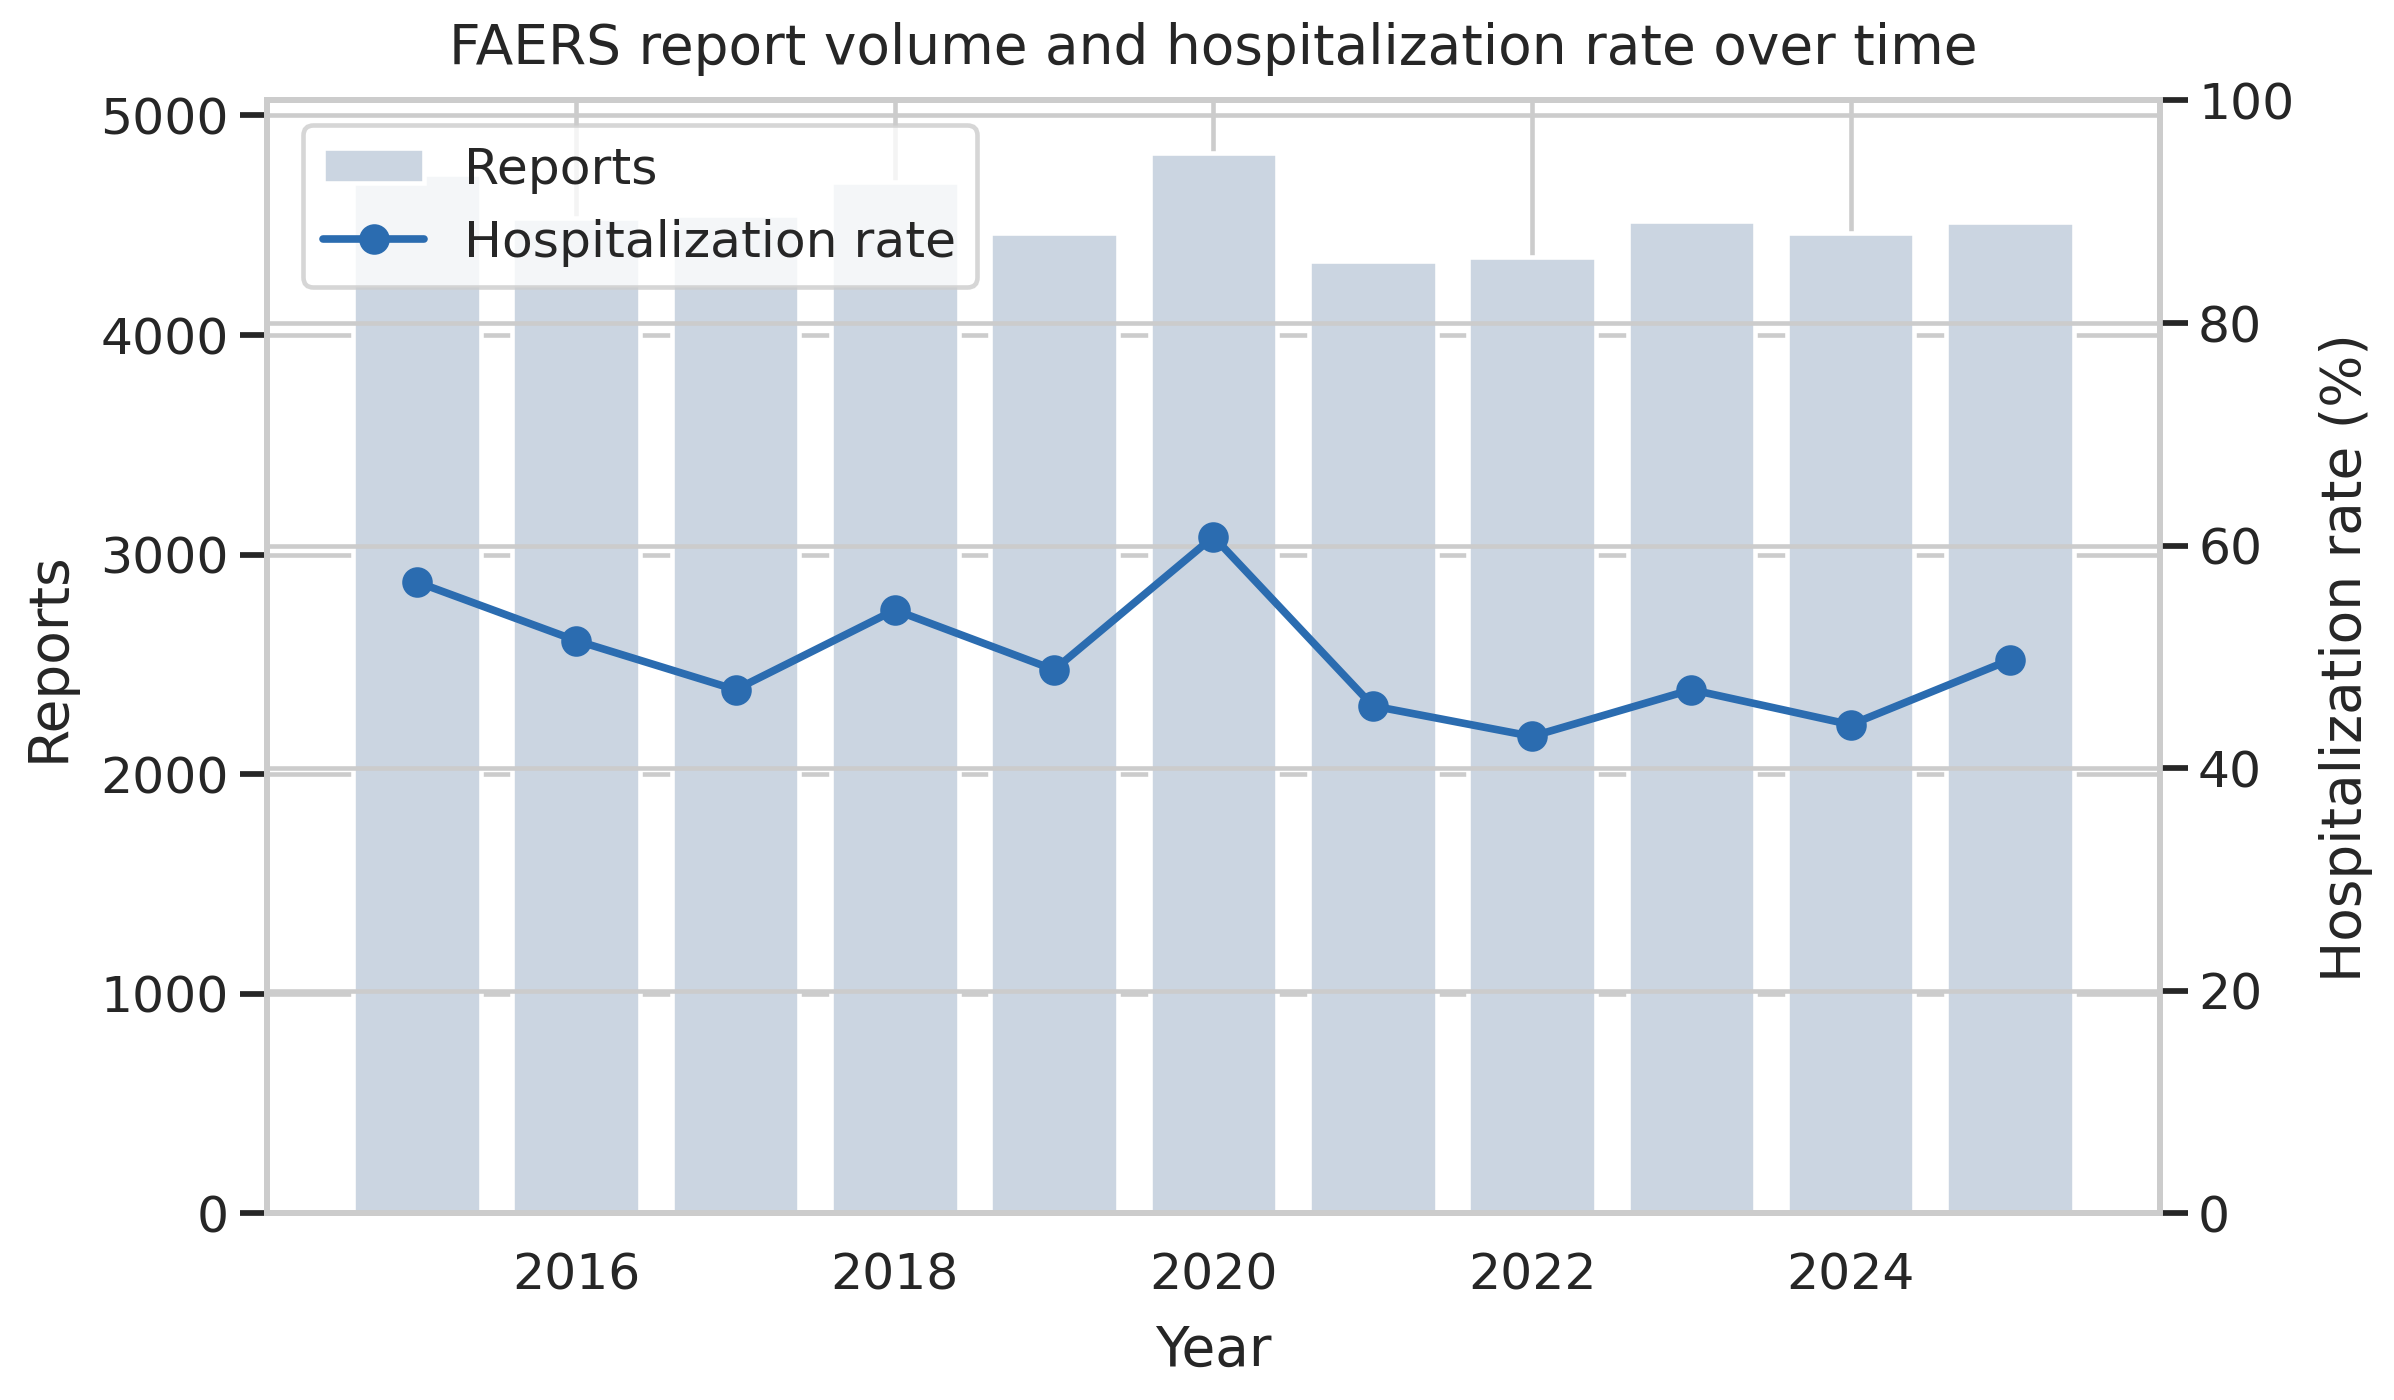
528,000 reports across 2015 through 2025, with intake volume growing over the period. Every row is one adverse event report submitted voluntarily and processed through FDA’s standard FAERS pipeline.
For modeling, I drew a balanced sample: 25,000 hospitalized reports and 25,000 non-hospitalized, stratified-split 80/20. Balancing the sample isolates the feature-level signal from the imbalance story and lets the classifier operate on class-balanced training data without any sampling-weight intervention inside the model. Whether that balancing is the right choice for deployment is a separate question the limitations section returns to.
Avoiding the leakage trap
Before fitting anything, six fields in the raw data carry outcome information too obviously to be used as features:
serious, serious_flags, is_fatal, is_life_threat, is_disabling, patient_recovered.
These are the FAERS seriousness fields. A model that uses is_fatal to predict hospitalization will appear to perform brilliantly because the two are correlated by construction — someone who died almost certainly was hospitalized first, so “is_fatal” is effectively a proxy for the target. Including any of the six produces inflated metrics that do not describe the screening ability the model actually has. All six are dropped from the feature set before modeling begins.
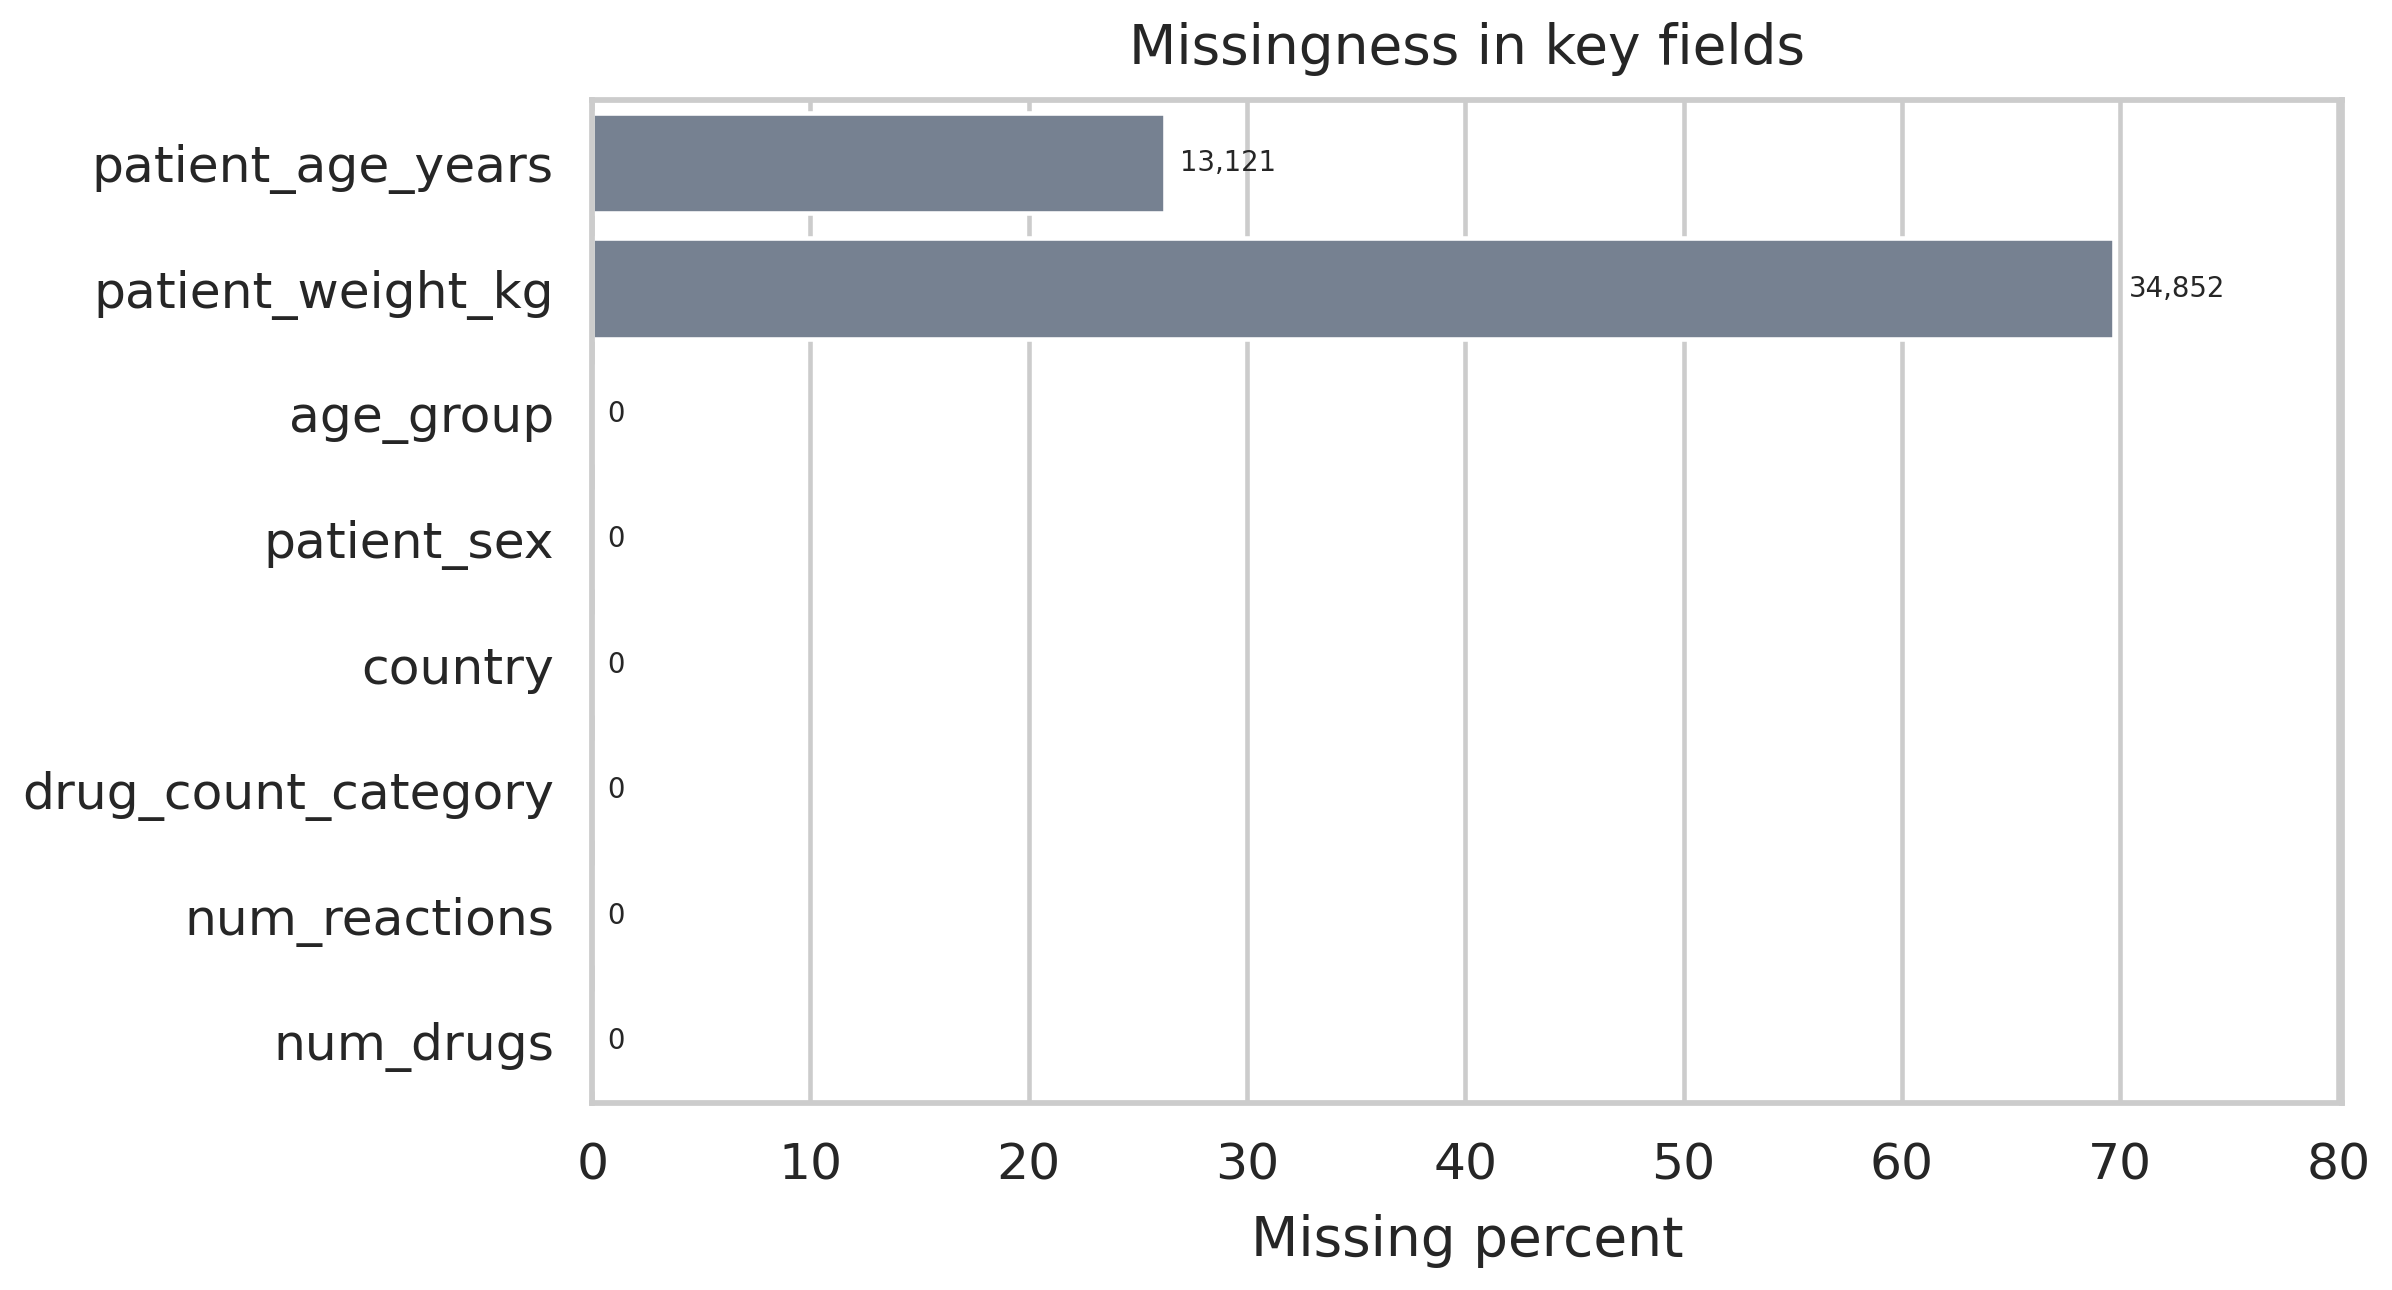
Missingness across retained features. Weight is missing on 69.7 percent of rows; age on 26.2 percent. That pattern informs the imputation strategy and constrains which feature engineering steps are worth running.
Missingness is heavy in places. Patient weight is not recorded for almost 70 percent of reports and patient age is absent on more than a quarter. Both variables are clinically meaningful, so median imputation is applied with a missingness indicator retained as a separate binary feature. That pattern lets the model distinguish “this patient was recorded as missing a weight value” from “this patient had a recorded weight,” which sometimes carries its own signal independent of the underlying quantity.
What the features are actually measuring
Once the pipeline is running, a small set of features ends up doing most of the predictive work. And the signal that rises to the top is the one that needs the most unpacking.
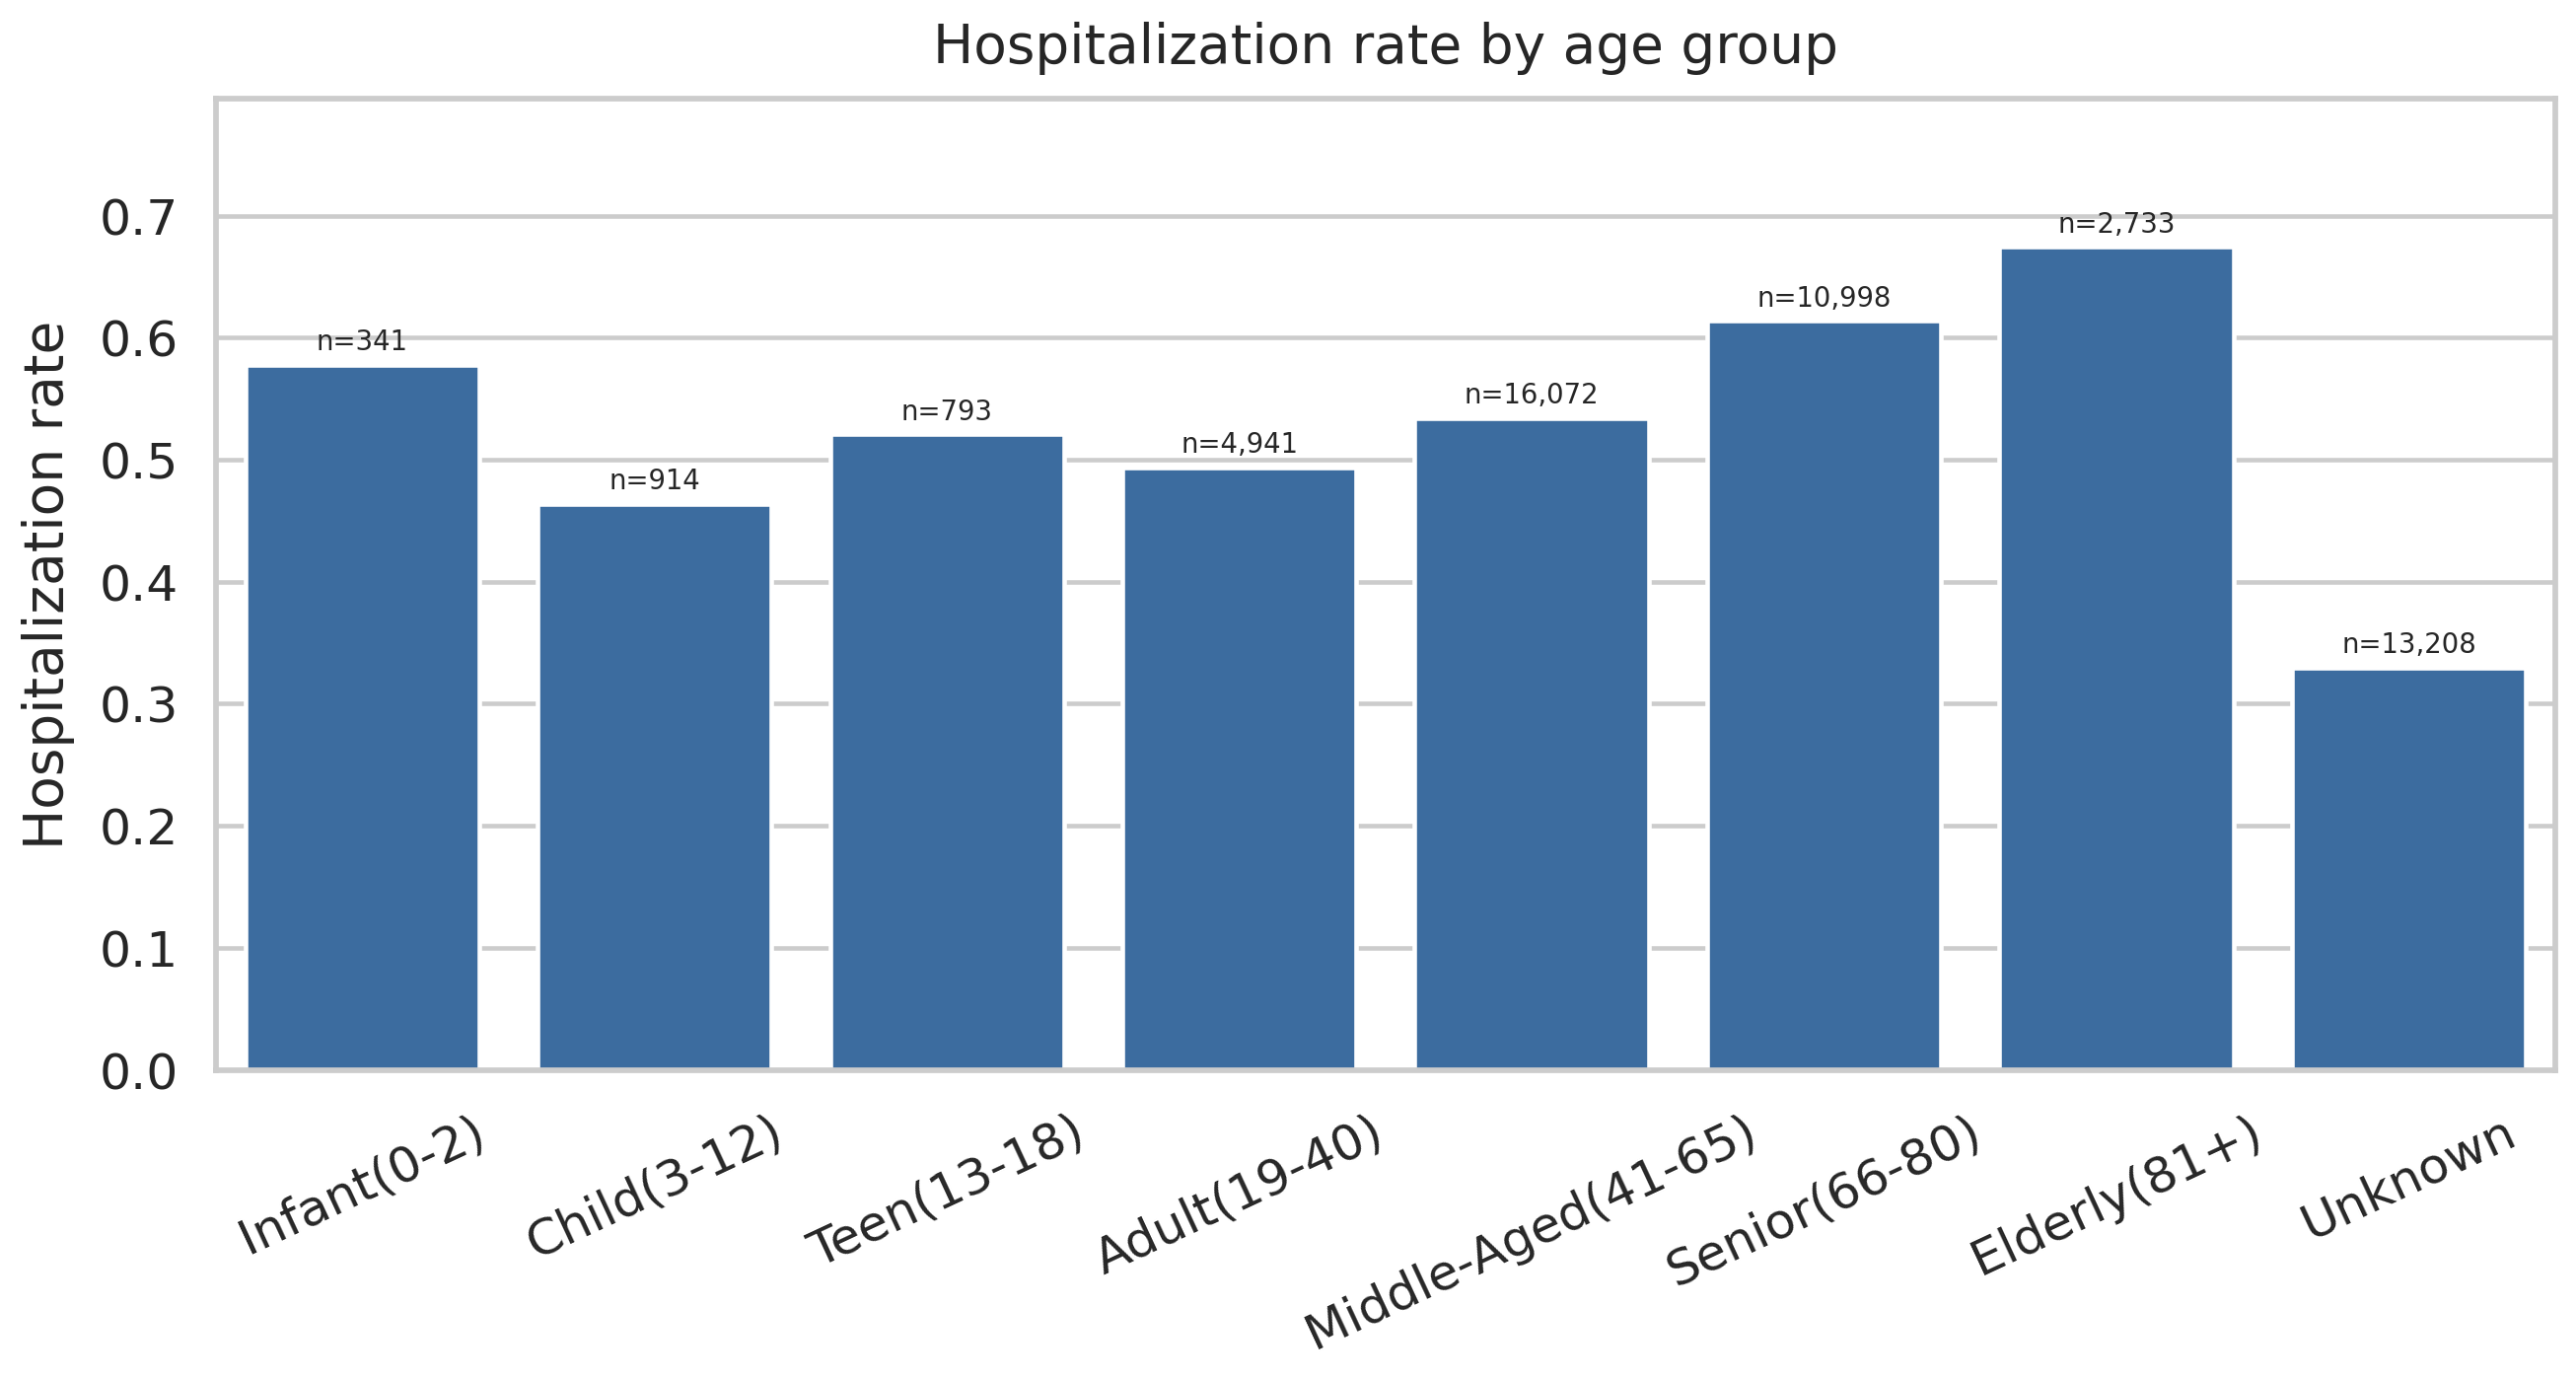
Hospitalization rate by age group. The elderly rate lands at 0.674. The pediatric rate carries a small sample but an elevated rate. These age brackets are doing real clinical work in the model.
Polypharmacy — reports involving multiple concomitant drugs — shows a hospitalization rate of 0.602. That is a well-documented clinical pattern; elderly patients on multiple medications experience more drug interactions, and interactions drive hospitalizations.
Then the surprise. Country of origin is the top-weighted feature in the Random Forest, with an importance score of 0.138, and per-country hospitalization rates in the raw data span 0.405 to 0.882. That range is not a clinical signal. It is a reporting-behavior signal. Different countries have different reporting requirements, different thresholds for what gets submitted to FAERS, and different mixes of mandatory versus voluntary submissions. A classifier that uses country as a feature is, to a significant extent, learning which countries’ reporting practices bias toward capturing severe events.
That is useful operationally — if the goal is ranking reports that deserve review, and country systematically correlates with severity of what gets reported, then country is a real feature for triage. But the interpretation cannot be that some countries have sicker patients. The interpretation is that some countries’ reporting systems produce higher-severity samples. Quarter and month of report submission carry similar signal: they are not clinical variables, they are calendar variables that reflect FDA-driven reporting cycles.
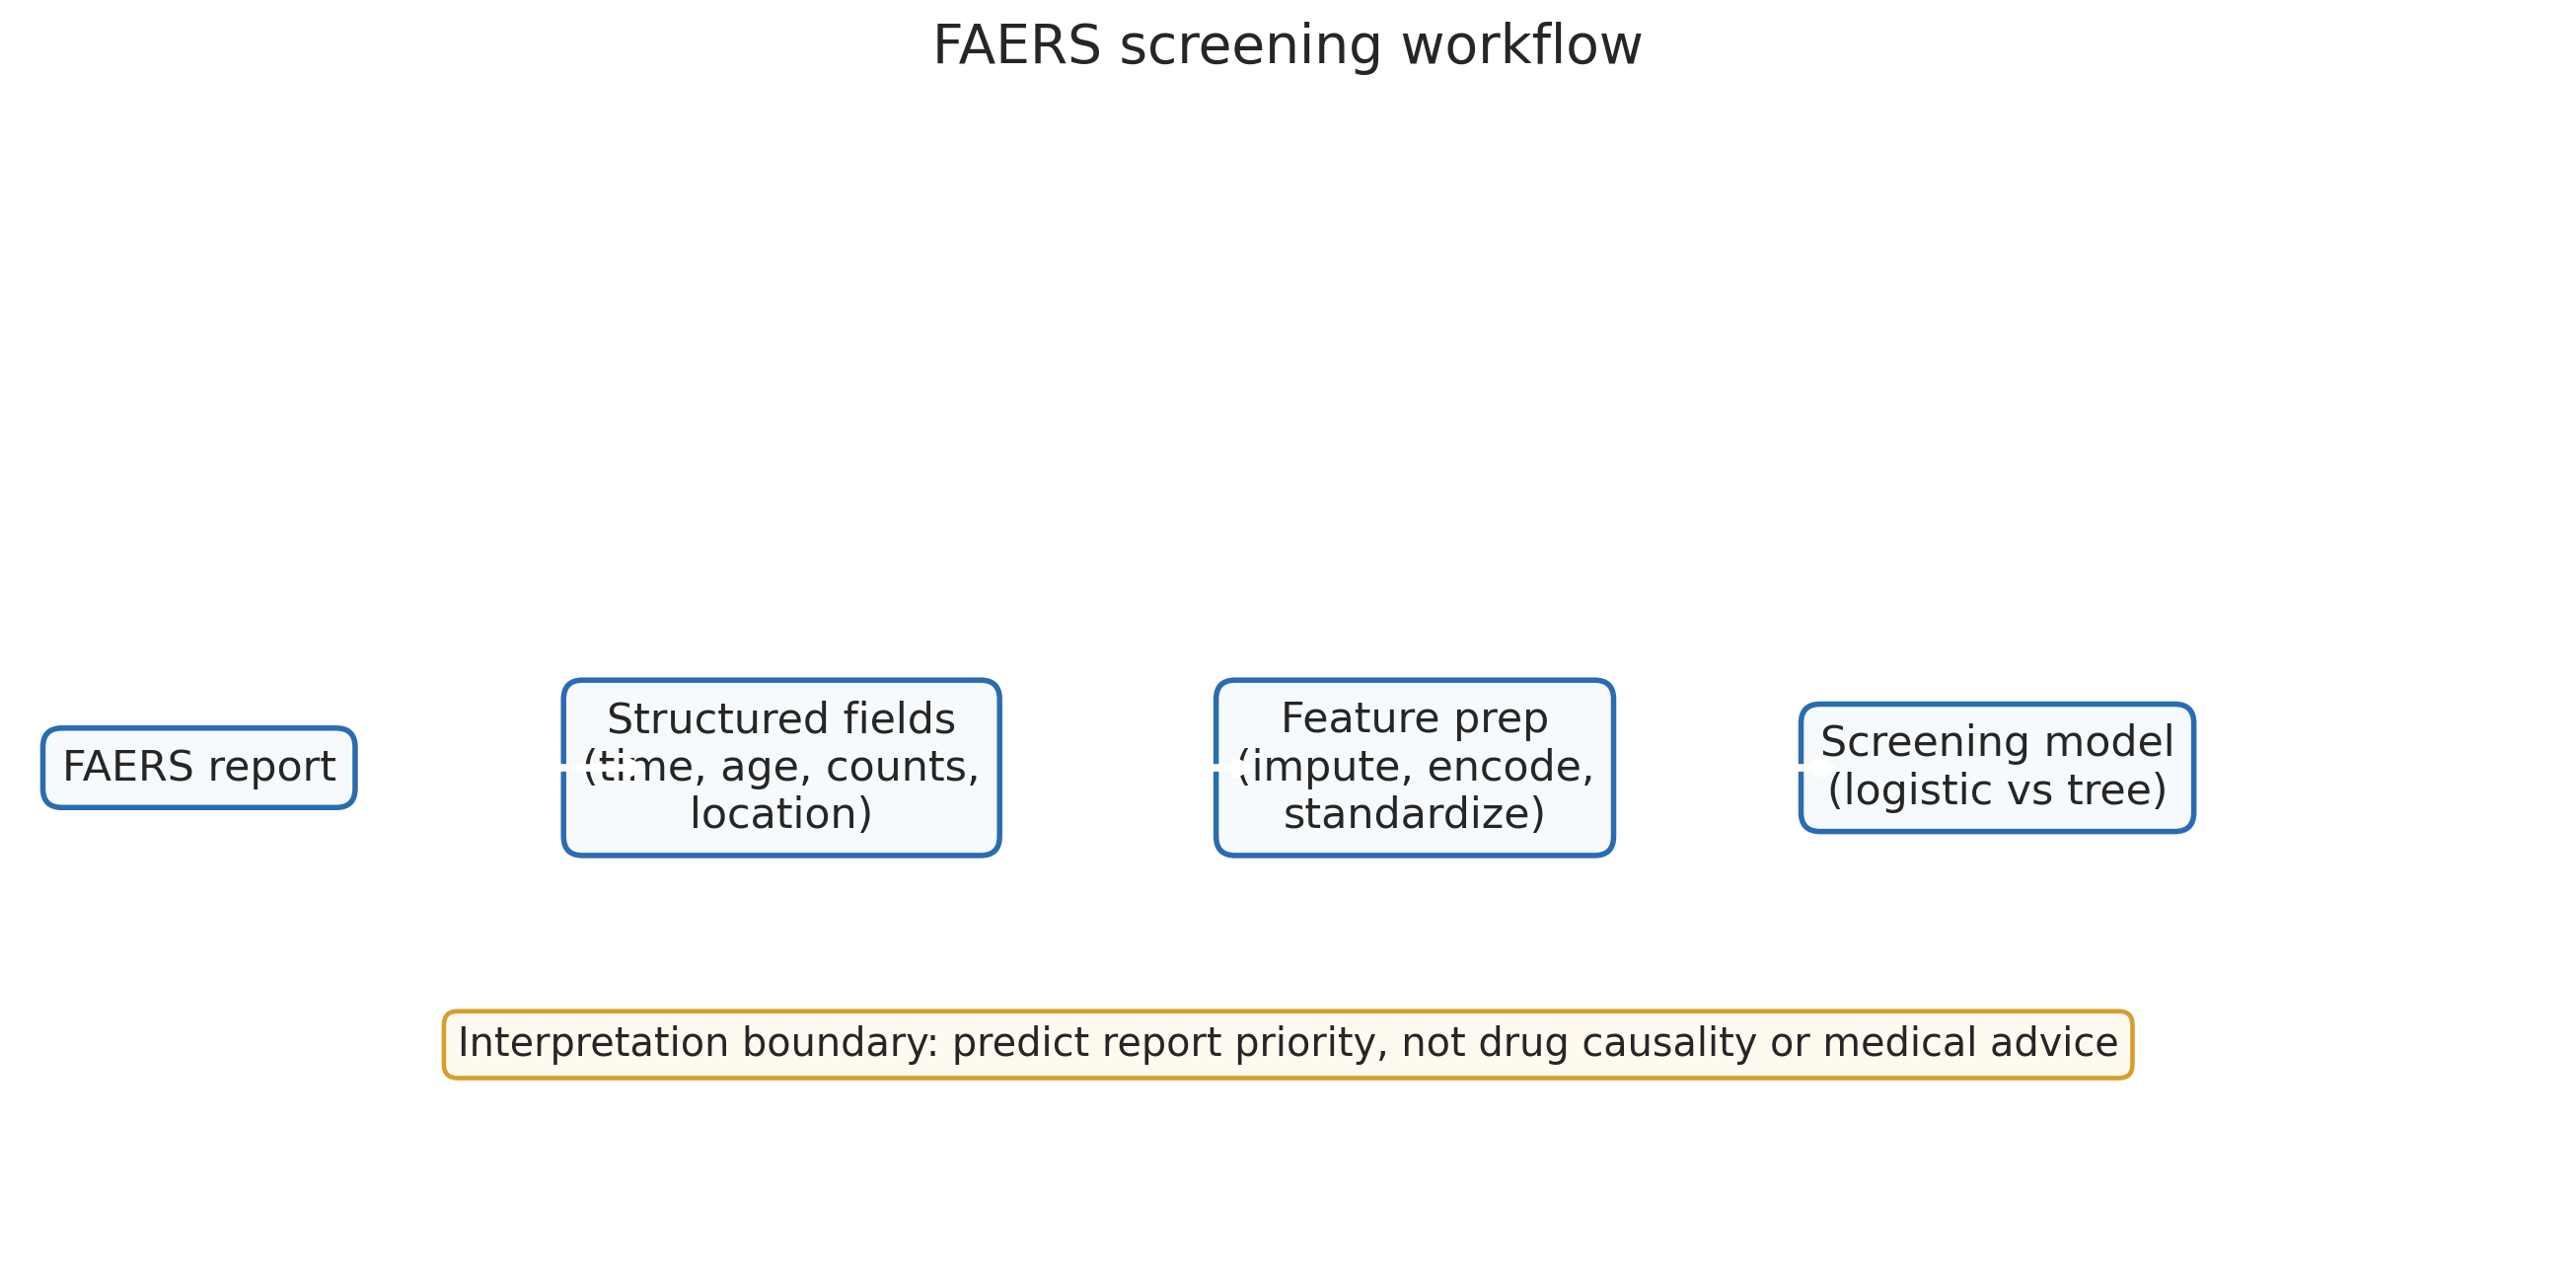
The preprocessing pipeline. Every step is reproducible from the raw quarterly FAERS files. The critical stages are the six-field exclusion and the country-signal interpretation.
Naming that ambiguity early matters because the next slide is the feature importance chart, and anyone looking at it without the context would read it as a clinical finding.
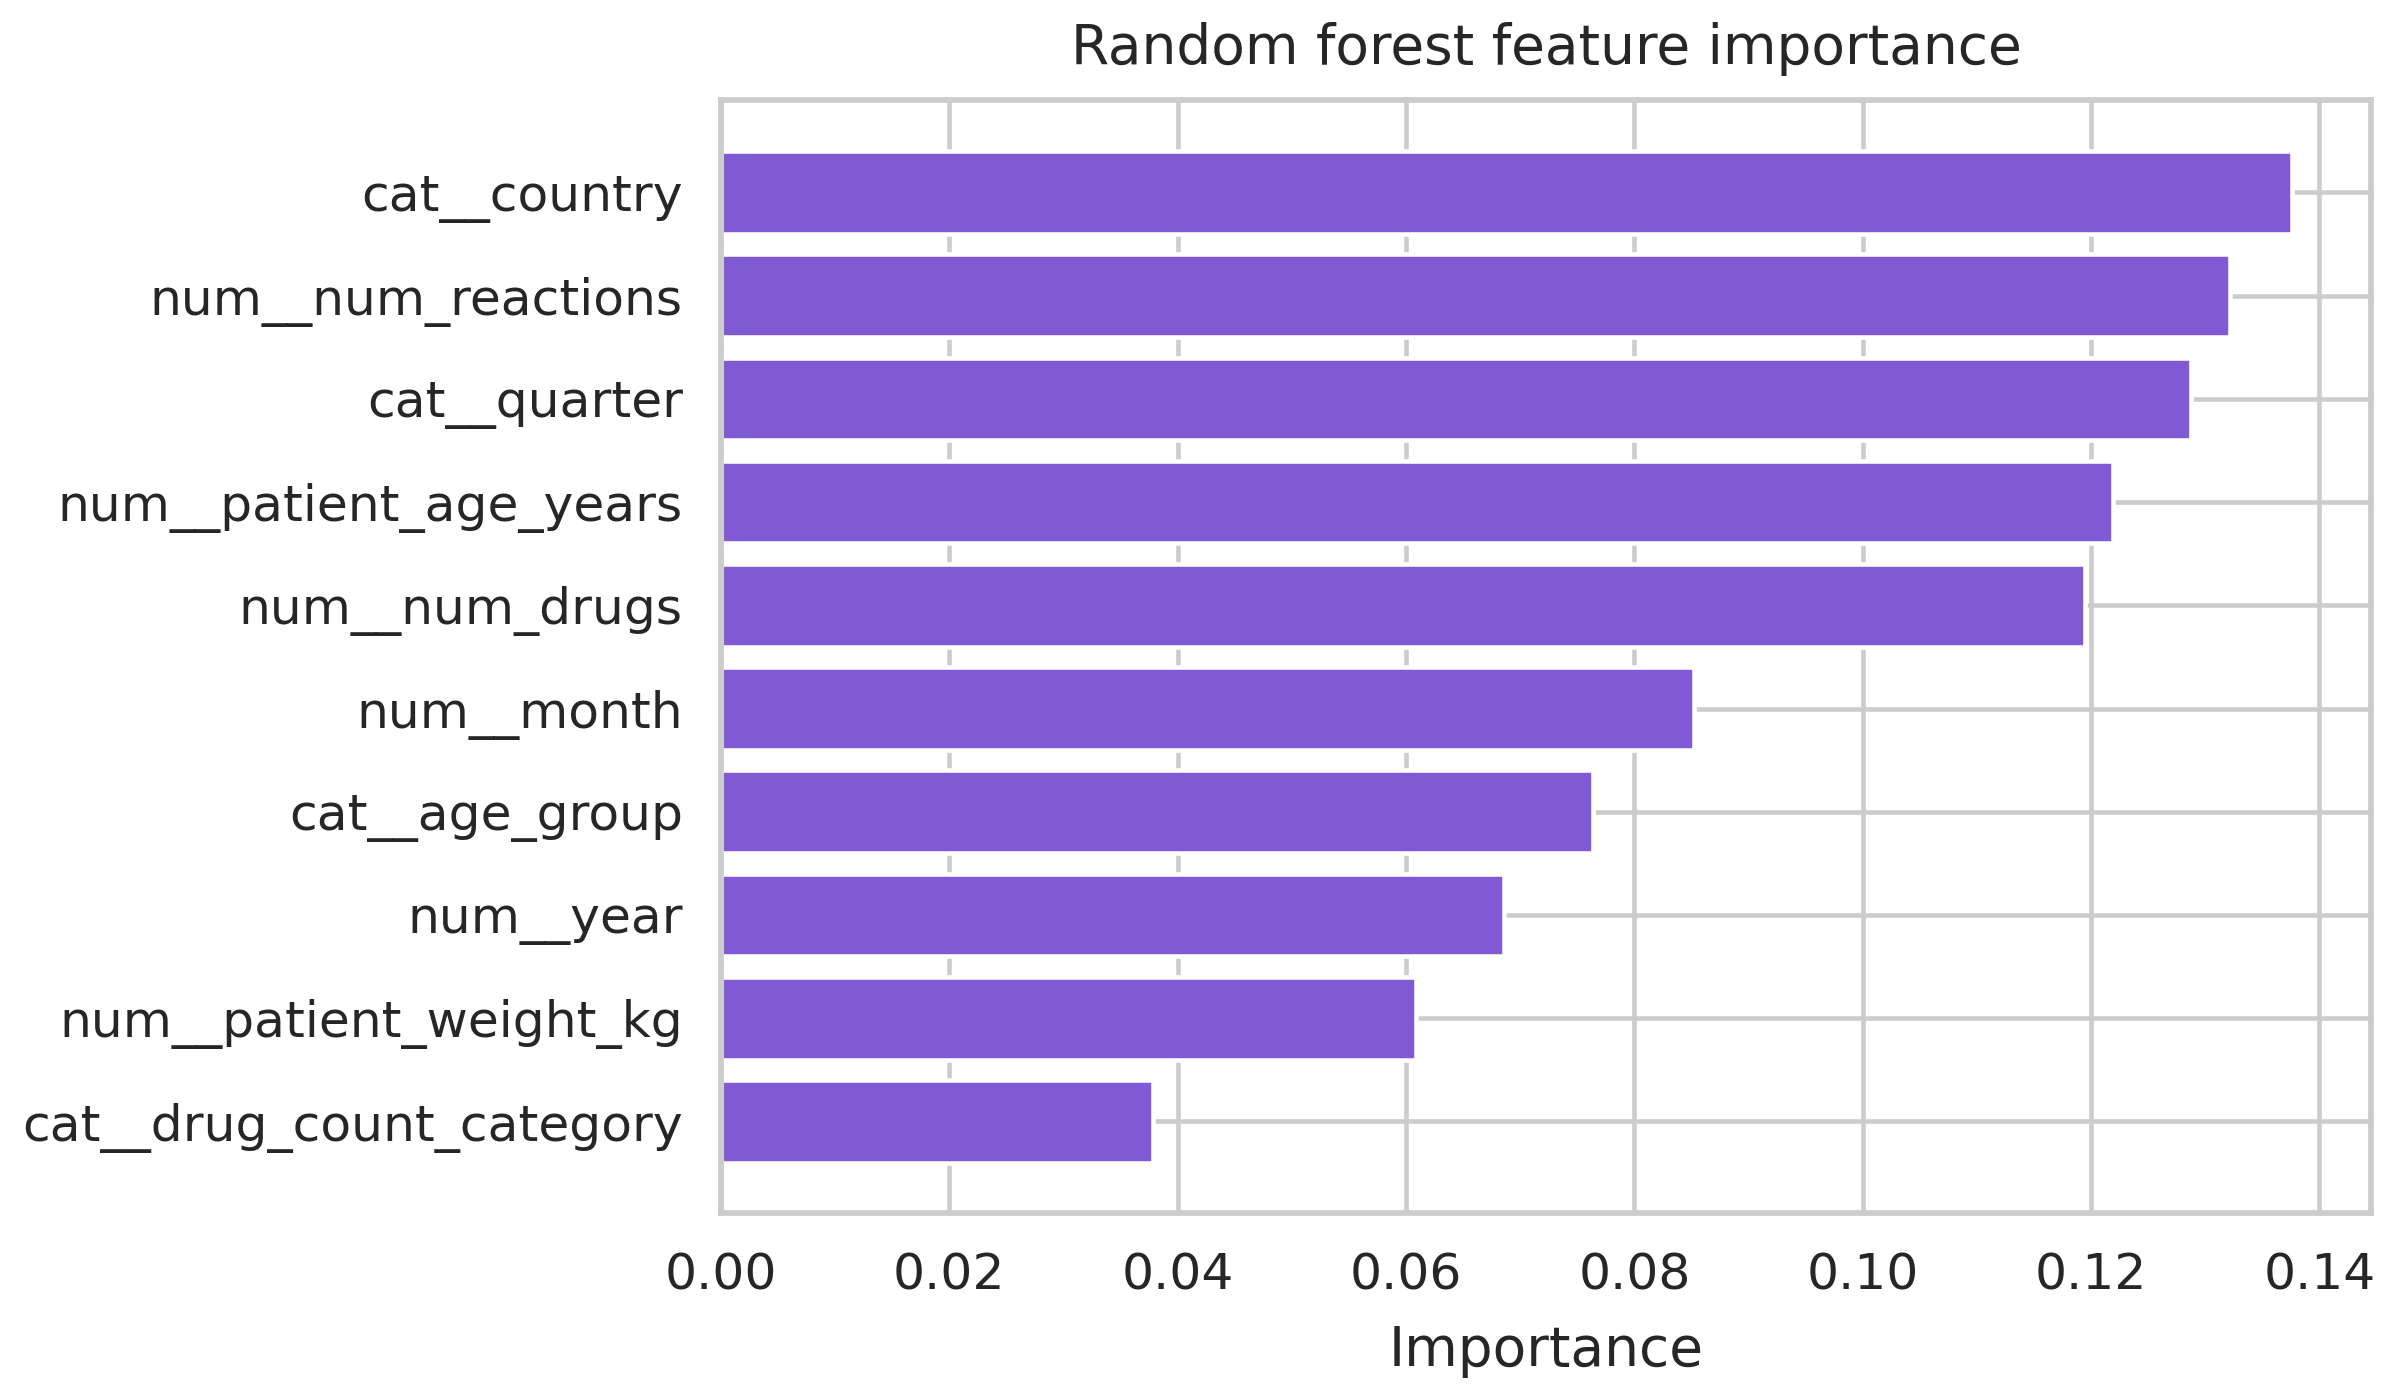
Random forest importance ranking. Country importance 0.138. Age-bracket and polypharmacy signals cluster behind it. Country at the top is a reporting-system signal, not a clinical severity signal, and the discussion section is where that distinction lives.
Two models
Two classifiers were fit on the same feature matrix: a logistic regression baseline and a random forest with 100 trees at scikit-learn defaults. Both are reasonable choices for structured tabular data of this size; the random forest has the capacity to model interactions the linear boundary cannot.
| Model | ROC-AUC | PR-AUC | Recall | F1 |
|---|---|---|---|---|
| Logistic regression | 0.739 | 0.718 | 0.675 | 0.679 |
| Random forest (100 trees) | 0.773 | 0.759 | 0.730 | — |
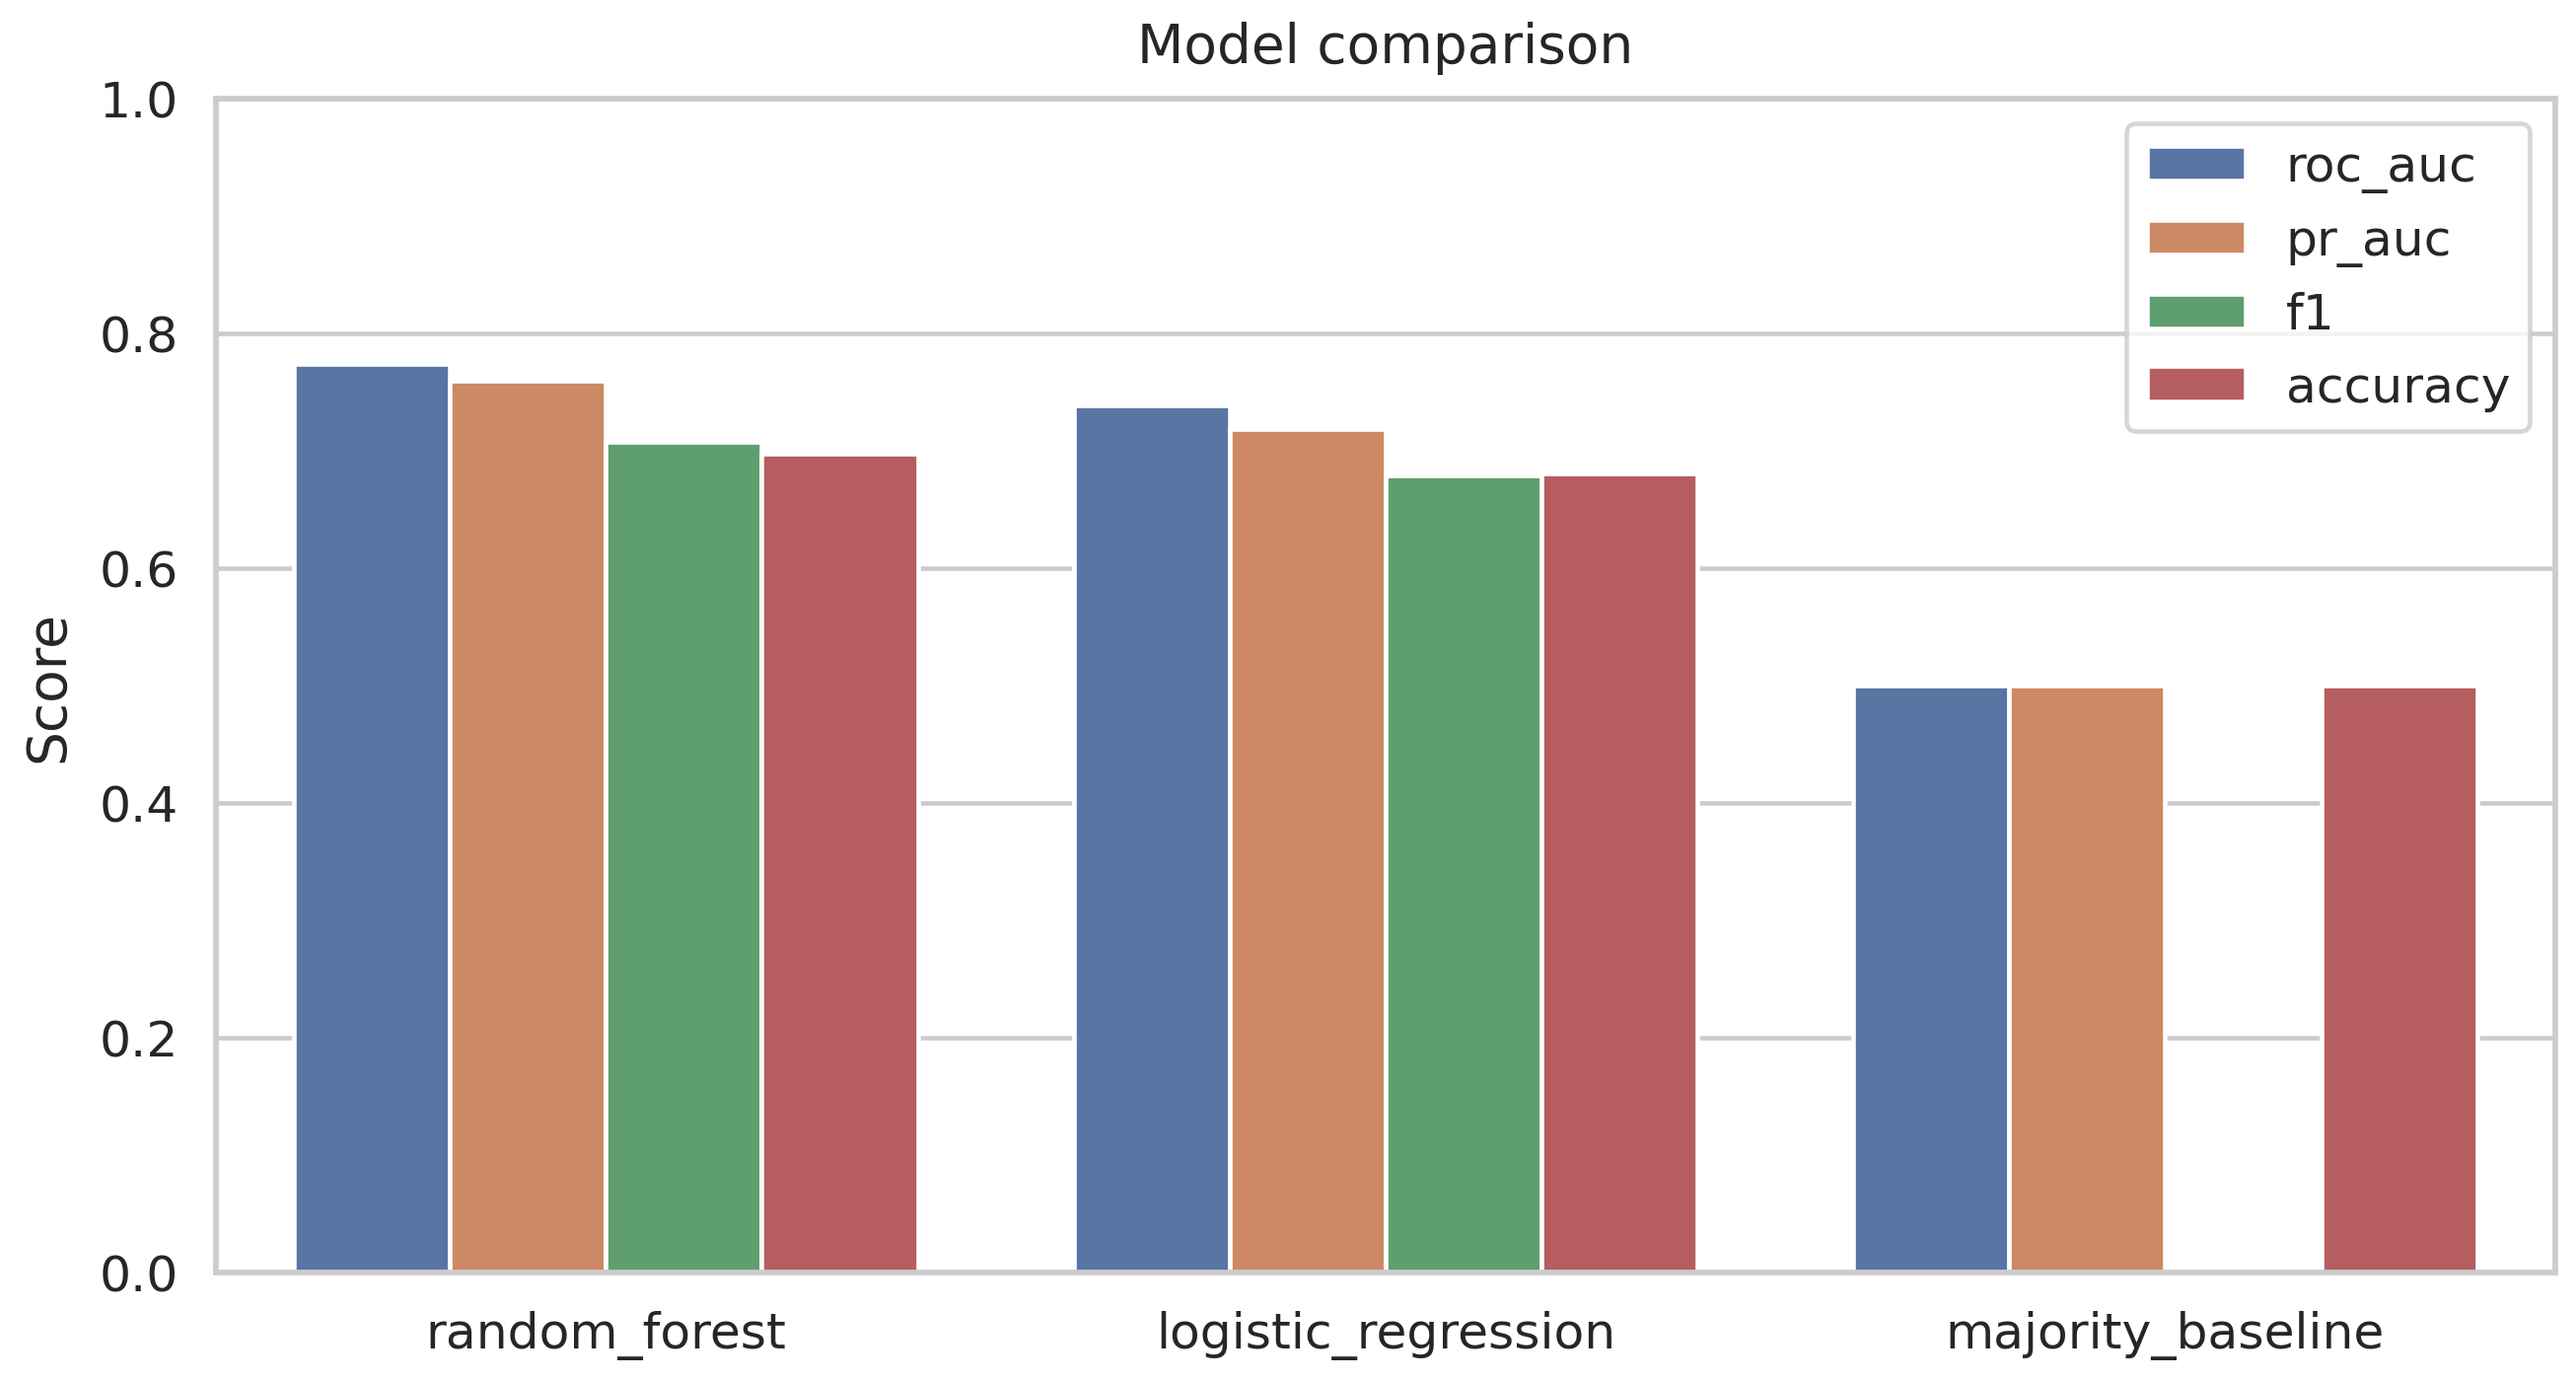
Random forest lifts recall from 0.675 to 0.730 and PR-AUC from 0.718 to 0.759. The improvement is consistent but modest. The model is not dramatically better than a linear baseline; it is meaningfully better on the axis that matters for ranking.
Recall is the primary metric. For a screening queue, the cost of a false negative (a hospitalized report buried low in the queue) exceeds the cost of a false positive (a non-hospitalized report pulled forward for review). ROC-AUC and PR-AUC are tracked together because ROC-AUC can look better than the data warrants on a balanced sample, while PR-AUC is more sensitive to the operational realities of ranking.
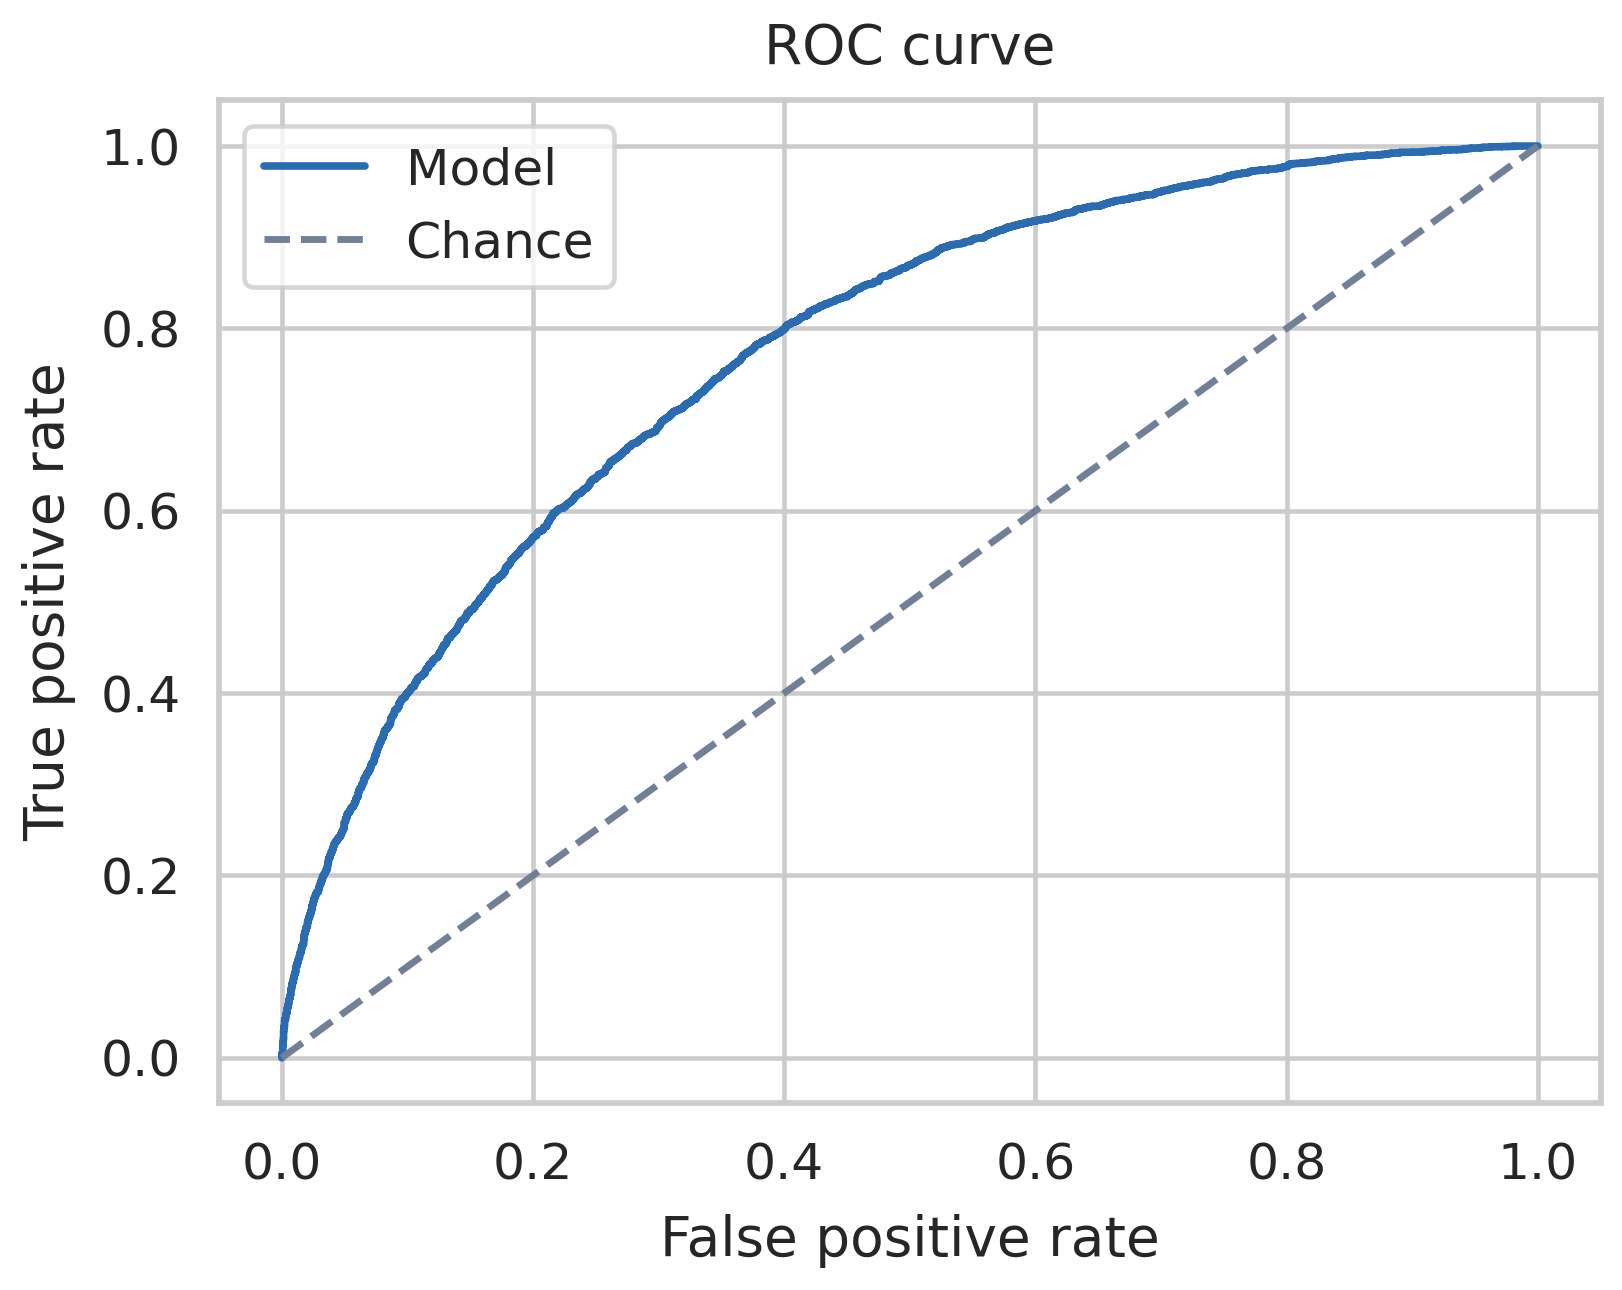
ROC curves for both models. The random forest bows slightly further toward the upper-left corner across most of the threshold range, which is the geometric restatement of the recall gap in the table above.
What the model is not
The deployment framing has to stay narrow enough to match what the data supports.
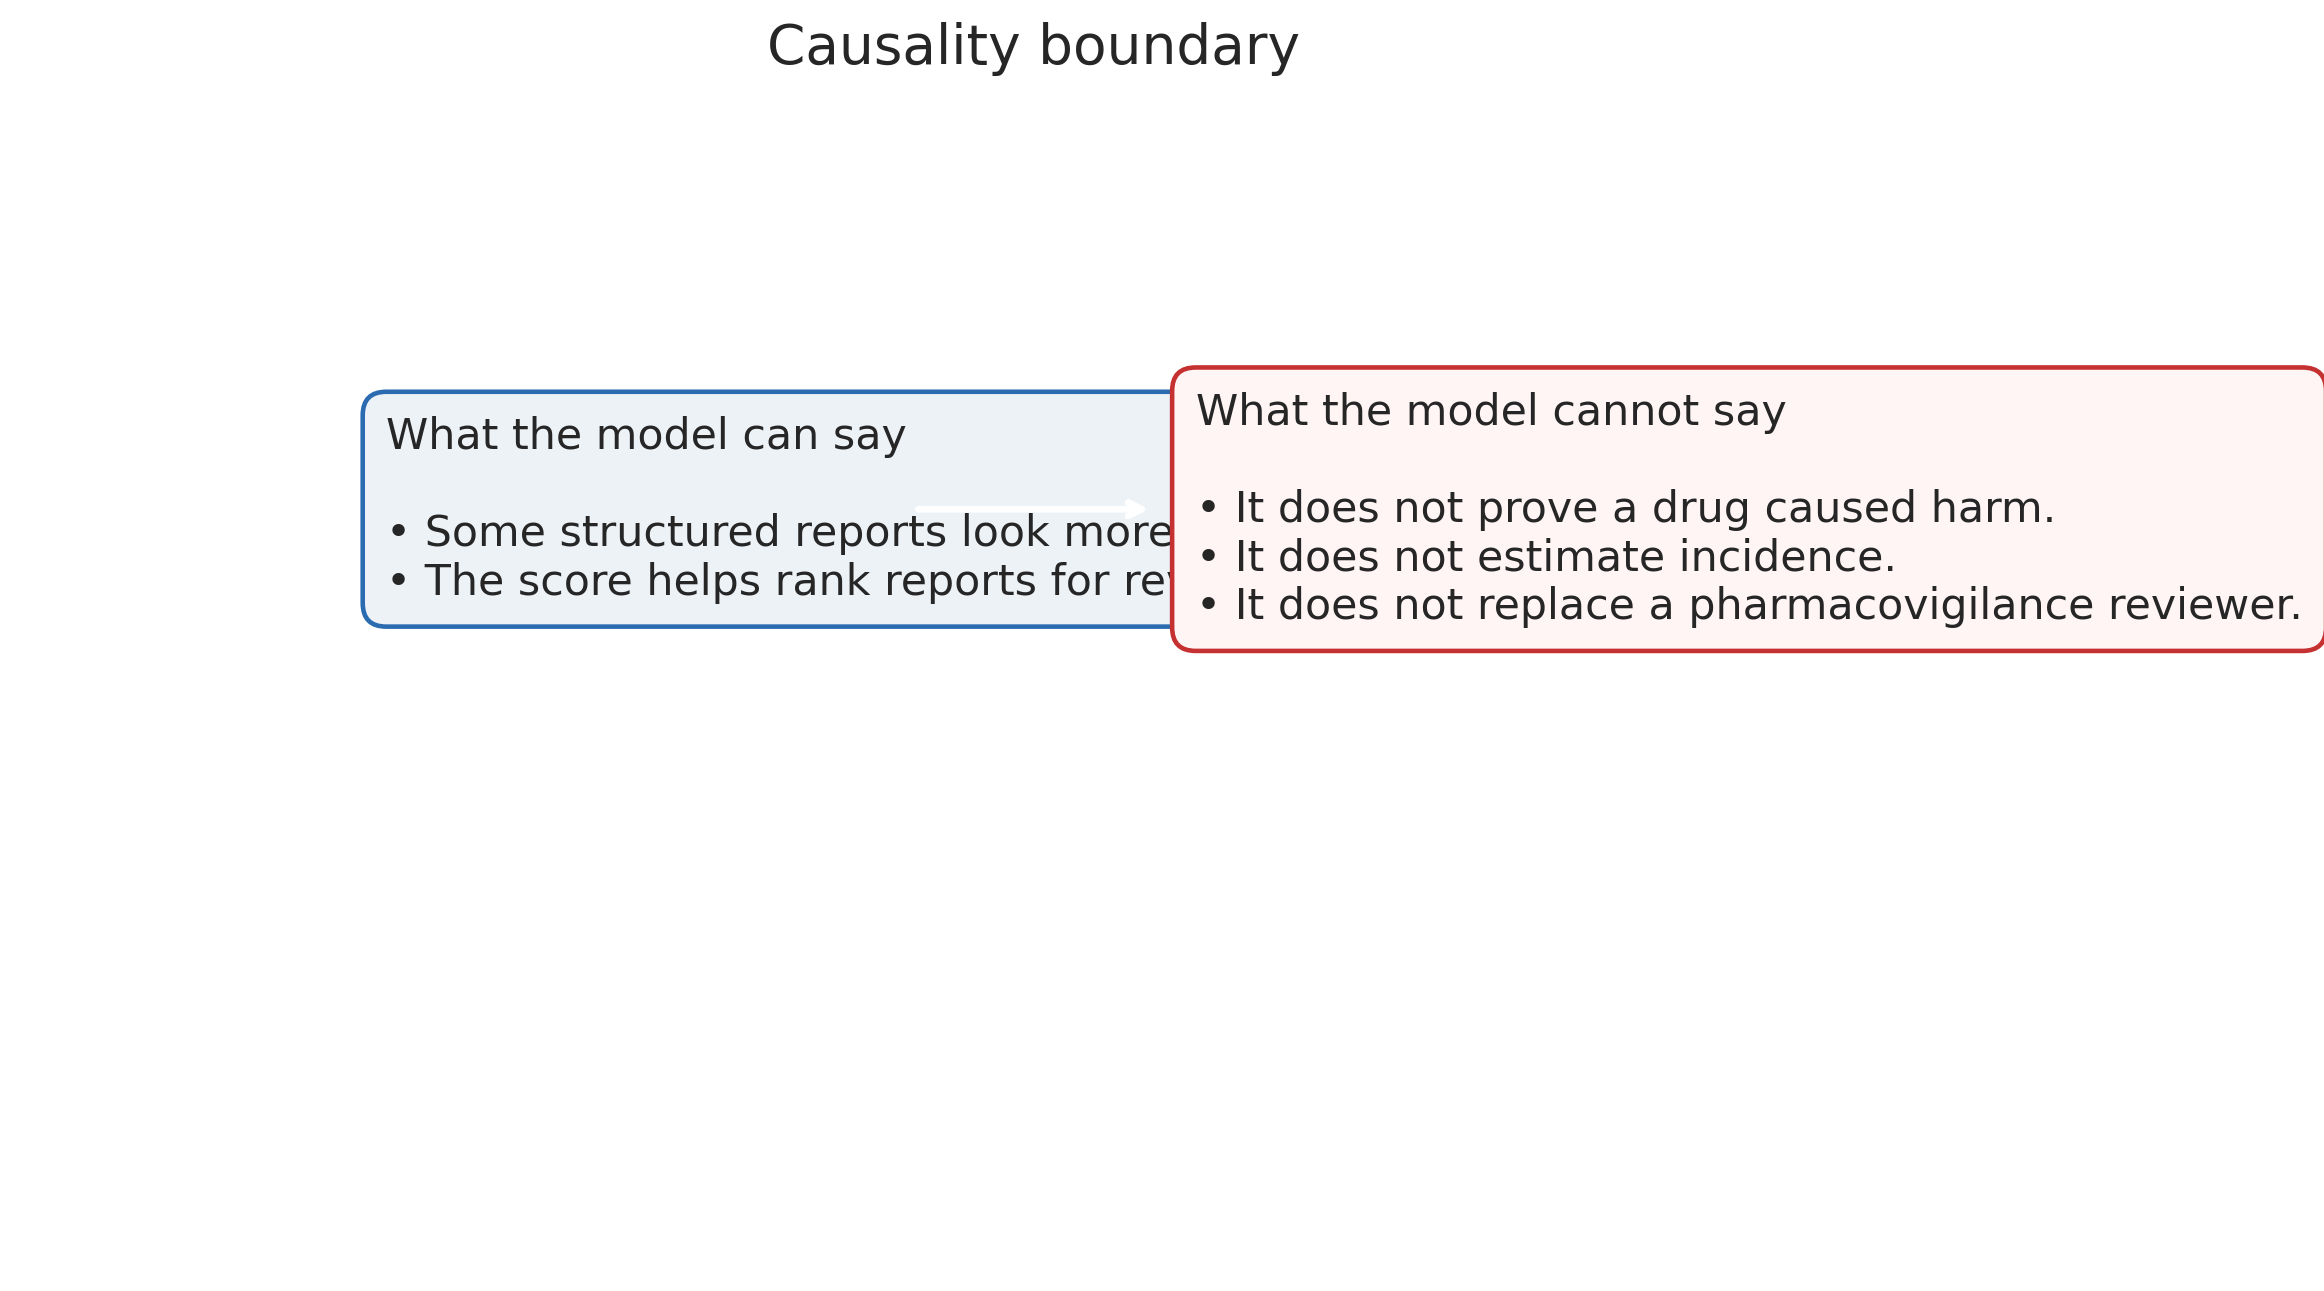
The model is a ranking tool. It is not a diagnostic model. It does not establish drug-event causality. It does not estimate population-level hospitalization risk. Those are different questions that require different methods and different data.
The model is a triage sort layer. It orders incoming reports by predicted hospitalization probability so reviewers open higher-risk reports first. That is the claim the results support.
The model is not a replacement for signal-detection methods. The disproportionality-analysis tradition — the multi-item gamma Poisson shrinker (DuMouchel, 1999), the proportional reporting ratio and reporting odds ratio family (Bate & Evans, 2009), the large-scale FDA screening work (Szarfman, Machado, & O’Neill, 2002) — asks a different question at a different unit of analysis. Signal detection works at the drug-event pair level, comparing observed and expected frequencies across many reports. This project works at the individual-report level. The two approaches are complementary. One helps decide which drug-event combinations deserve regulatory attention. The other helps decide which specific reports to review first.
The model does not establish causality. A report flagged as high hospitalization risk is not a claim that the drug caused the hospitalization. It is a statement that the combination of features in the report looks like the combination of features in reports that historically involved hospitalization. The distinction is operationally important because a reviewer reading a high-scored report still has to make the clinical determination about whether the drug contributed to the outcome. The ranking shifts attention; it does not substitute for judgment.
The model does not estimate population risk. FAERS data is voluntary and sample-biased, so model probabilities describe the labeled population of reporters, not the underlying patient population.
Deployment notes
The production framing would run the model as a quarterly-retrained scoring service over incoming reports, not as a one-shot classifier. Retraining quarterly matches FDA’s own FAERS release cadence and keeps the model current against shifting reporting patterns. A subgroup fairness audit would run before any go-live, especially against country, because the country signal is large and the interpretation of that signal is ambiguous — a deployment that systematically prioritizes reports from certain countries’ reporting systems over others, on the basis of reporting-system bias rather than clinical severity, would need to be documented and defended.
Every score produced in a live setting should be logged with the input features, the model version, the operating threshold, and the reviewer’s final disposition. That logging is what makes the triage layer auditable in a way the informal triage it replaces is not.
Reproducibility note
The pipeline runs end-to-end from the raw quarterly FAERS files through cleaning, the six-field exclusion, imputation, feature engineering, the balanced sample draw, the 80/20 stratified split, and both model fits. Source code, the notebook, and the figure outputs live in the public repository at github.com/ndjstn/drug-adverse-events-faers. The raw quarterly data files are downloaded from the FDA FAERS public release portal.